. 2000 Dec 1;20(23):8812-21.
doi: 10.1523/JNEUROSCI.20-23-08812.2000.

Stable Hebbian learning from spike timing-dependent plasticity

Affiliations

Stable Hebbian learning from spike timing-dependent plasticity

M C van Rossum et al. J Neurosci. .

Abstract

We explore a synaptic plasticity model that incorporates recent findings that potentiation and depression can be induced by precisely timed pairs of synaptic events and postsynaptic spikes. In addition we include the observation that strong synapses undergo relatively less potentiation than weak synapses, whereas depression is independent of synaptic strength. After random stimulation, the synaptic weights reach an equilibrium distribution which is stable, unimodal, and has positive skew. This weight distribution compares favorably to the distributions of quantal amplitudes and of receptor number observed experimentally in central neurons and contrasts to the distribution found in plasticity models without size-dependent potentiation. Also in contrast to those models, which show strong competition between the synapses, stable plasticity is achieved with little competition. Instead, competition can be introduced by including a separate mechanism that scales synaptic strengths multiplicatively as a function of postsynaptic activity. In this model, synaptic weights change in proportion to how correlated they are with other inputs onto the same postsynaptic neuron. These results indicate that stable correlation-based plasticity can be achieved without introducing competition, suggesting that plasticity and competition need not coexist in all circuits or at all developmental stages.


Figures

Fig. 1.
Fig. 1.
Spike timing-dependent plasticity. a, Synapses are potentiated if the synaptic event precedes the postsynaptic spike. Synapses are depressed if the synaptic event follows the postsynaptic spike. b, The time window for synaptic modification. The relative amount of synaptic change is plotted versus the time difference between synaptic event and the postsynaptic spike. The amount of change falls off exponentially as the time difference increases. In addition, the amount of potentiation decreases for stronger synapses, whereas the relative amount of depression is independent of synaptic size.
Fig. 2.
Fig. 2.
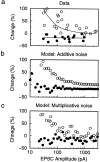
The weight dependence of the STDP conductance change. a, The data from Bi and Poo (1998)describing the relative synaptic change as a function of the initial synaptic size. Potentiating (open circles) and depressing (filled circles) pairings were repeated 60 times. The depression data are fitted to a constant; the potentiation data are inversely proportional to the synaptic size. b, Additive noise model: the data is simulated by applying the plasticity rule 60 times. After every synaptic change a random conductance value is added. The random conductance is drawn from a Gaussian distribution with zero mean and SD of 8 pA. This description of the noise was rejected. c, Simulation of the data using a multiplicative noise model, in which the noise in the conductance change is weight dependent. Multiplicative noise gives a better description of the spread in the data.
Fig. 3.
Fig. 3.
a, The equilibrium distribution of the synaptic weights of a neuron after prolonged synaptic stimulation with uncorrelated Poisson trains. Histogram, Distribution of weights from a simulation of an integrate and fire neuron. Solid line, Analytical prediction from Equation 14, with Wtot extracted from Figure 7. Dashed line, Analytical prediction when strong synapses do not have an enhanced probability for potentiation. Simulation parameters: 20 Hz input rate, postsynaptic firing rate ∼25 Hz, weights were averaged over 10 runs. b, Experimental quantal amplitude distribution as observed from a single cultured cortical pyramidal neuron. c, When potentiation and depression do not depend on the weight, as was assumed in many other models, a bimodal weight distribution results. Limits on the minimal and maximal weight have to be imposed (wmin = 0 and wmax); the weights cluster at these limits.
Fig. 4.
Fig. 4.
Effect of correlation in the inputs on the synaptic weights. The inputs consisted of four groups of 25 synapses having different amounts of correlation within the group (correlation coefficients: 0, 0.033, 0.066, 0.1). a, The probability for inducing potentiation, pp and depression pd vs. the weight. The probability for inducing potentiation is increased when correlations between inputs are present, whereas the probability for inducing depression is unaltered. Thelabels indicate the correlation coefficient. b, The weight distributions of the different groups. The different amounts of correlation lead to the coexistence of multiple weight distributions. The weights of the more strongly correlated groups are larger. The inset shows the mean conductance of the different groups as a function of the correlation.
Fig. 5.
Fig. 5.
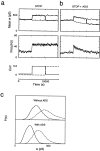
Competition between synaptic inputs and the effect of activity-dependent scaling (ADS). a, Behavior of model without ADS. Bottom graph, The neuron receives input from two sets of 50 synapses. Until time 5000 sec, both sets are uncorrelated. At 5000 sec the inputs within one set become strongly correlated, potentiating its weights. At 10,000 sec this set becomes again uncorrelated, whereas the other set becomes correlated, reversing the situation. Middle graph, The postsynaptic firing frequency jumps when the inputs become correlated. Top graph, The average synaptic weight for the two sets. The introduction of correlation potentiates the synapses, but changes in one group of synapses barely affect the other group. Competition is almost absent. b, Same situation but with activity-dependent scaling turned on. After the jump in firing rate the synapses are slowly scaled downward, until the activity is again at its goal value of 20 Hz. This introduces competition. Note the difference in time-scales between the slow competition and the much faster STDP. c, The corresponding weight distributions once equilibrium has been reached. The activity-dependent scaling scales the weights of both groups.
Fig. 6.
Fig. 6.
Diagram of the evolution of the synaptic weight distribution. Every time-step the number of synapses within a bin can change: with a probability pd the synapse depresses an amount wd, or with a probability pp the synapse is potentiated an amount wp. Similarly, synapses with initially a different weight can enter the bin. Finally, a steady state distribution is reached. Bottom graph shows the net weight change (drift), which determines whether on the average a weight will increase (positive drift) or decrease (negative drift).
Fig. 7.
Fig. 7.
The probability for a synapse to induce potentiation. a, b, The membrane potential in the presence of a constant background current is plotted versus time. At theasterisk a synaptic event occurs. a, If this occurs long before the spike, the membrane potential makes a step, and the interspike interval is shortened. b, If the synaptic event occurs when the membrane potential is already close to threshold, an immediate spike is the result. c, Combining these two possible events gives the probability of the time between synaptic event and spike, plotted for three values of the synaptic weight w: 0, medium and large (left to right). d, The weight dependence of the probability to induce depression and potentiation. The probability for depression, pdis independent of the synaptic weight. The probability for potentiation, pp is linear in the weight, expressing the contribution of the synaptic event to the postsynaptic spike. In this simulation the weights are fixed (uniformly distributed). The probability that the synaptic event and the postsynaptic spike fall within a short time window is measured. This corresponds to the probability that the synapse would be depressed (δt < 0) or potentiated (δt > 0). The excitatory synapses were driven at 1 Hz, firing the cell at ∼50 Hz.

Similar articles

Cited by

References

    1. Amarasingham A, Levy WM. Predicting the distribution of synaptic strengths and cell firing correlations in a self-organizing, sequence prediction model. Neural Comput. 1998;10:25–57. - PubMed
    1. Bekkers JM, Richerson GB, Stevens CF. Origin of variability in quantal size in cultured hippocampal neurons and hippocampal slices. Proc Natl Acad Sci USA. 1990;87:5359–5362. - PMC - PubMed
    1. Bell CC, Han VZ, Sugawara Y, Grant K. Synaptic plasticity in cerebellum-like structure depends on temporal order. Nature. 1997;387:278–281. - PubMed
    1. Bi G-Q, Poo M-M. Synaptic modifications in cultured hippocampal neurons: dependence on spike timing, synaptic strength, and postsynaptic cell type. J Neurosci. 1998;18:10464–10472. - PMC - PubMed
    1. Bienenstock EL, Cooper LN, Mundo PW. Theory for the development of neuron selectivity: orientation specificity and binocular interaction in visual cortex. J Neurosci. 1982;2:32–48. - PMC - PubMed

LinkOut - more resources