. 2000 Dec 1;20(23):8876-85.
doi: 10.1523/JNEUROSCI.20-23-08876.2000.

Enhanced vulnerability to cocaine self-administration is associated with elevated impulse activity of midbrain dopamine neurons

Affiliations

Enhanced vulnerability to cocaine self-administration is associated with elevated impulse activity of midbrain dopamine neurons

M Marinelli et al. J Neurosci. .

Abstract

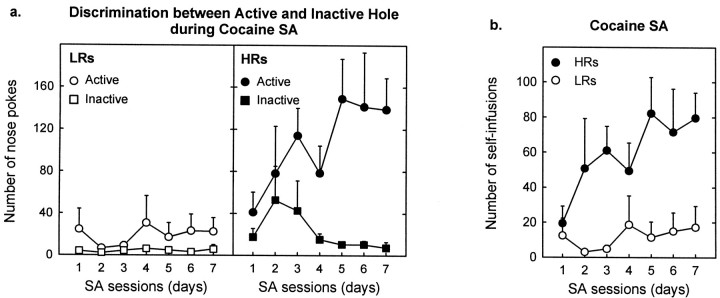
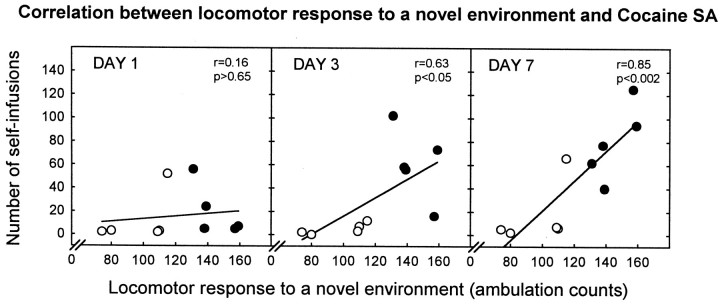
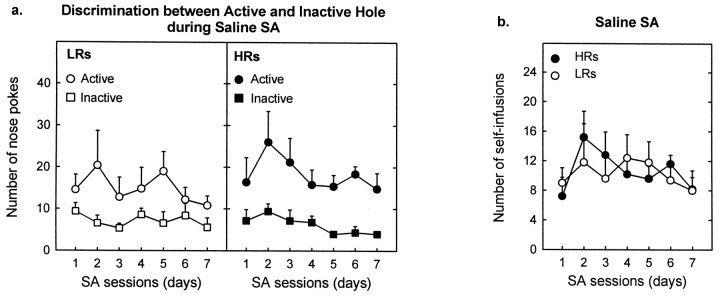
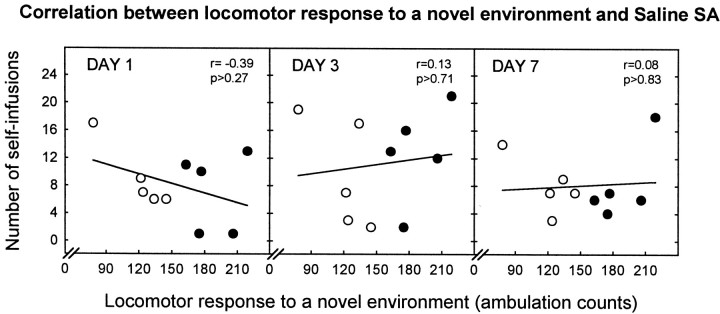
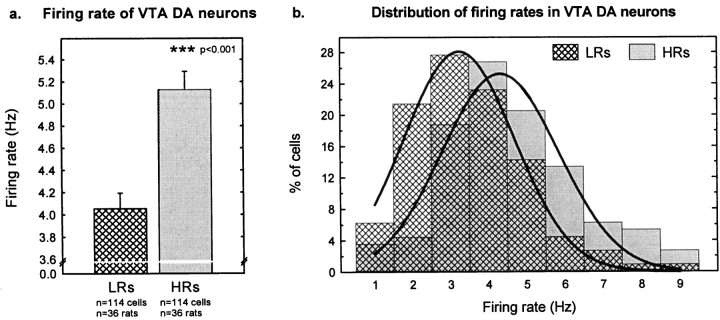
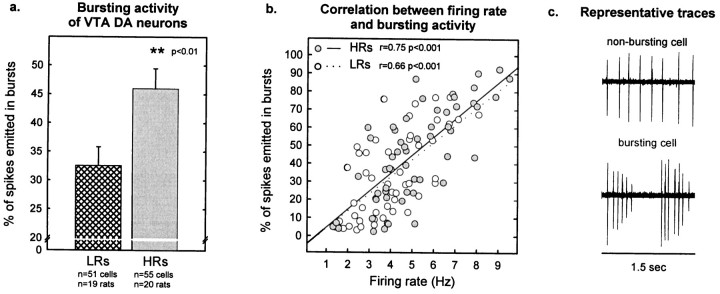
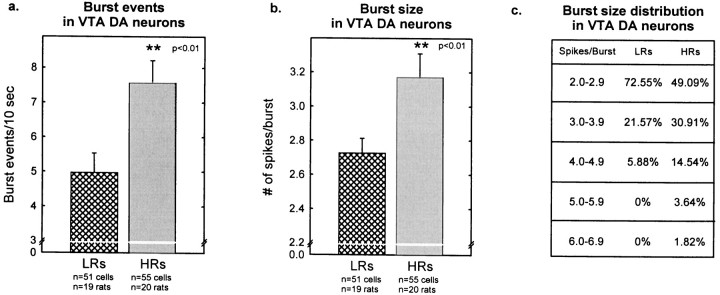
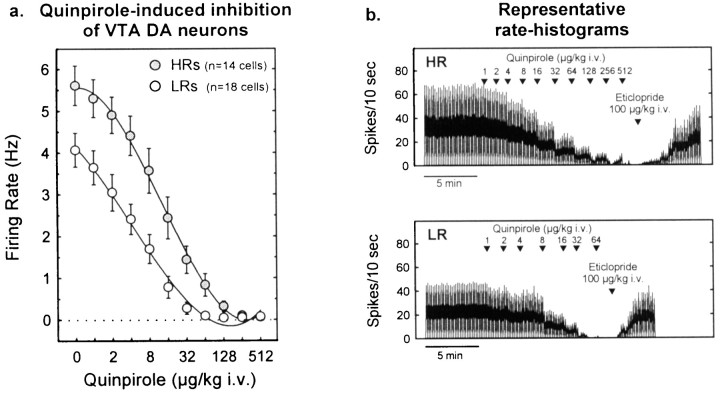
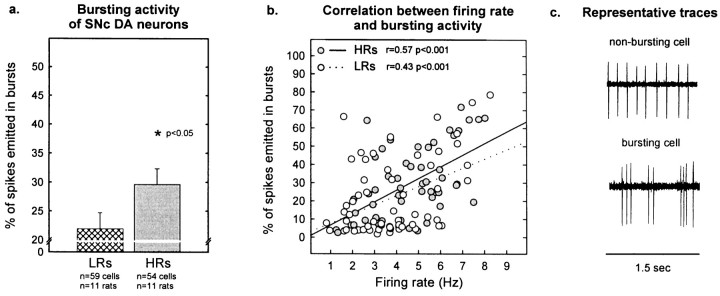
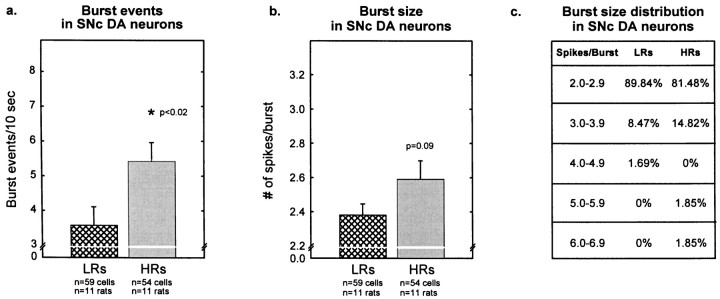
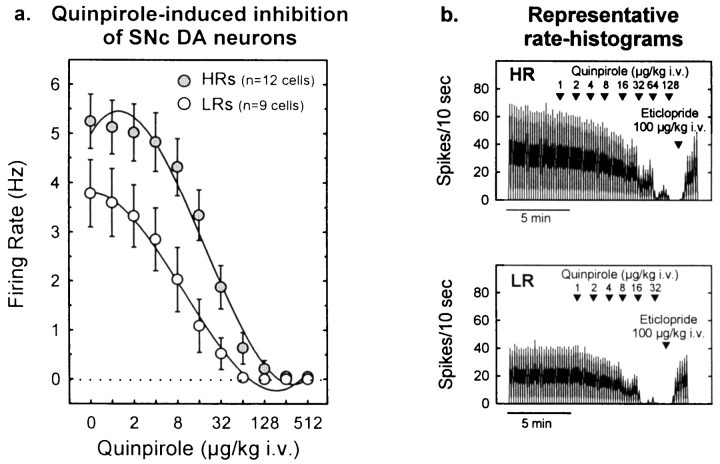
Individual differences in responding to a novel environment predict behavioral and neurochemical responses to psychostimulant drugs. Rats with a high locomotor response to a novel environment (HRs) exhibit enhanced self-administration (SA) behavior, sensitization, and basal or drug-induced dopamine release in the nucleus accumbens compared with rats with a low response to the novel context (LRs). In this study, we determined whether such differences in vulnerability to drug addiction might be related to differences in dopamine (DA) neuron activity. Rats were divided into HRs and LRs according to their response to a novel environment and then tested for acquisition of cocaine SA. HRs rapidly acquired cocaine SA (175 microg/kg per infusion), whereas LRs did not. Differences in cocaine SA were not caused by differences in exploratory behavior or sampling because these behaviors did not differ in HRs and LRs self-administering a saline solution. In a separate experiment, we used extracellular single-unit recordings and found that HRs exhibit higher basal firing rates and bursting activity of DA neurons in the ventral tegmental area and, to a lesser extent, in the substantia nigra pars compacta. The greater activity of midbrain DA cells in HRs was accompanied by reduced sensitivity to the inhibitory effects of a DA D2-class receptor agonist, indicating possible subsensitivity of impulse-regulating DA autoreceptors. These results demonstrate that differences in the basal activity of DA neurons may be critically involved in determining individual vulnerability to drugs of abuse.


Figures

Fig. 1.
Fig. 1.
HRs acquire cocaine SA (175 μg/kg per infusion), whereas LRs do not. a, HRs and LRs discriminated differently between the active and inactive holes [group × hole interaction, F(1,8) = 25.0;p < 0.001]. LRs showed no preference for the active hole versus the inactive one throughout the testing procedure [hole effect, F(1,4) = 1.4;p > 0.3; hole × days interaction,F(6,24) = 0.85; p> 0.5], indicating that they did not acquire cocaine SA. Instead, HRs developed active hole preference during the 7 d of testing [hole effect, F(1,4) = 48.1;p < 0.002; hole × days interaction,F(6,24) = 2.67; p< 0.05], denoting the acquisition of cocaine SA behavior. HRs also displayed greater responding in the active hole [group effect,F(1,8) = 37.1; p < 0.001] and slightly higher inactive hole responding [group effect,F(1,8) = 4.3; p = 0.08] compared with LR rats. b, HR rats showed greater cocaine intake (number of self-infusions) compared with LRs [group effect, F(1,8) = 23.4;p < 0.001]. This difference was present throughout the cocaine SA experiment [group × days interaction,F(6,48) = 1.08; p> 0.39]; however, an examination of the figure indicates that no differences were present during the first SA session. Eachpoint represents the mean ± SEM of each group.
Fig. 2.
Fig. 2.
The response to a novel environment is correlated with the development of cocaine SA. There was an overall positive correlation between the locomotor response to a novel environment and average infusions of cocaine over the 7 d of testing (data not shown; r = 0.82;p < 0.01). The different scatter plots illustrate that this correlation was not present on day 1; it emerged on day 3 and was maintained until day 7. Each point represents an individual rat. Empty circles represent LR rats;filled circles represent HRs.
Fig. 3.
Fig. 3.
HRs and LRs show no differences in SA for saline.a, The two groups of animals equally discriminated between the active and inactive holes [group × hole interaction,F(1,8) = 1.1; p > 0.3; group × hole × days interaction,F(6,48) = 0.54; p> 0.7], showing a marked preference for the active hole (associated with the 3 sec light and the infusion of saline) over the inactive one [hole effect, F(1,8) = 21.8;p < 0.002]. In addition, HRs and LRs exhibited similar nose-poking behavior in the active and inactive hole [group effect, F(1,8) = 0.37;p > 0.5; F(1,8) = 0.33; p > 0.5, respectively]. When the saline solution was replaced with cocaine (175 μg/kg per infusion), however, nose-poking behavior primarily resembled (data not shown) that observed in our first experiment (see Fig. 1). This change from saline to cocaine induced a change in the active hole responding in HRs but not in LRs [group × drug × days interaction,F(6,48) = 3.5; p < 0.01]. HRs increased nose poking in the active hole [drug effect,F(1,4) = 14.3; p < 0.02], whereas LRs did not modify active hole responding [drug effect, F(1,4) = 1.33;p > 0.3]. Neither group modified inactive hole responding at any time [group × drug interaction,F(1,8) = 0.001; p> 0.98; group × drug × days interaction,F(6,48) = 0.44; p> 0.84]. The change from saline to cocaine modified the discrimination of the active versus inactive hole between the two groups [group × drug × hole × days interaction,F(6,48) = 3.1; p < 0.02]. Thus, in agreement with our first cocaine SA experiment, during cocaine SA, LRs did not show preference for the active versus the inactive hole [hole effect, F(1,4) = 2.3; p > 0.2], whereas HRs maintained a strong preference for the active hole [hole effect,F(1,4) = 14.2; p < 0.02]. Each point represents the mean ± SEM of each group. b, The number of reinforcers (self-infusions of saline associated with a 3 sec light in the active hole) was similar in HR and LR rats [group effect,F(1,8) = 0.02; p > 0.9] and remained constant throughout the saline SA sessions [group × days interaction,F(6,48) = 0.88; p> 0.5]. When saline was replaced with cocaine, however, SA behavior primarily reproduced (data not shown) that obtained in our first experiment (see Fig. 2). This switch from saline to cocaine induced a change in SA behavior in HRs but not in LRs [group × drug × days interaction, F(6,48) = 2.4;p < 0.04]. Thus, HRs rapidly increased their number of self-infusions [drug effect,F(1,4) = 35.3; p < 0.01], whereas LRs did not modify their intake behavior [drug effect,F(1,4) = 1.35; p > 0.3]. Each point represents the mean ± SEM of each group.
Fig. 4.
Fig. 4.
No relationship between the locomotor response to a novel environment and saline SA. There was no correlation between the response to a novel environment and average infusions of saline over the 7 d of testing (r = −0.12;p > 0.7; data not shown). In addition, there was no correlation between these two behaviors on any of the days tested. The scatter plots depict results from days 1, 3, and 7 of saline SA. Each point represents an individual rat. Empty circles represent LR animals; filled circlesdepict HRs.
Fig. 5.
Fig. 5.
Firing rates in VTA DA cells. a, HRs exhibited a higher basal firing rate than did LRs (t226 = −4.94; p< 0.001). Each verticalbar represents the mean ± SEM of each group. b, The distribution curve of the DA firing rates (percentage of cells firing at a particular rate) was similar in HRs and LRs, except that the curve was shifted ∼1 Hz to the right in HRs compared with LRs.Verticalbars represent the percentage of cells firing at a particular rate for each group of rats.
Fig. 6.
Fig. 6.
Bursting activity in VTA DA cells.a, HRs exhibited a higher percentage of spikes emitted in bursts compared with LRs (t104 = −2.79; p < 0.01). Each vertical bar represents the mean ± SEM of each group.b, The scatter plot illustrates the relationship between firing rate and bursting activity. There was a similar positive correlation between these two variables in both groups of animals (for LRs, r = 0.66; p < 0.001; for HRs, r = 0.75; p < 0.001; comparison of the regression slopes between the two groups,p > 0.4). Each point represents an individual cell. Empty circles depict cells from LRs;filled circles are cells from HRs. c, Representative traces of a nonbursting or bursting DA cell are shown.
Fig. 7.
Fig. 7.
Burst events and burst size in VTA DA cells.a, HRs exhibited a higher number of burst events per 10 sec compared with LRs (t104 = −3.03;p < 0.01). b, HRs showed larger burst sizes (number of spikes per burst) compared with LR rats (t104 = −2.66; p< 0.01). Each vertical bar represents the mean ± SEM of each group. c, The distribution of burst size illustrates that HR rats had a smaller percentage of cells with two-spike bursts and a greater percentage of cells with larger bursts compared with LRs.
Fig. 8.
Fig. 8.
Autoreceptor-mediated inhibition of firing in VTA DA cells. a, Cumulative dose–response curves illustrating that the DA D2-class receptor agonist quinpirole induced a dose-dependent decrease in firing activity in both HRs and LRs [dose effect, F(10,300) = 153.0;p < 0.001]. This inhibition was attenuated in HRs compared with LRs [group effect,F(1,30) = 10.23; p< 0.01; group × dose interaction,F(10,280) = 6.5; p< 0.001]. The ANCOVA considering the basal firing rate (quinpirole dose 0) as the covariate [group effect,F(1,29) = 3.6; p = 0.06; group × dose interaction,F(9,270) = 7.4; p< 0.001] indicates that these differences were not exclusively caused by a difference in basal firing activity. Each pointrepresents the mean ± SEM of each group. b, Representative rate histograms showing examples of recordings from an HR or LR animal. Note the greater doses of quinpirole required to inhibit the firing of VTA DA neurons in HR animals compared with LRs. The effects of quinpirole were reversed by the D2-class receptor antagonist eticlopride (100 μg/kg, i.v.).Arrowheads indicate the time points at which quinpirole or eticlopride was administered; numbers indicate the infusion dose (in micrograms per kilogram).
Fig. 9.
Fig. 9.
Firing rates of SNc DA cells. a, HRs exhibited a higher basal firing rate than did LRs (t120 = −2.40; p< 0.02). Each verticalbar represents the mean ± SEM of each group. b, The distribution curve of DA firing rates (percentage of cells firing at a particular rate) was similar in HRs and LRs, except that the curve was shifted ∼1 Hz to the right in HRs compared with LRs. Verticalbars represent the percentage of cells firing at a particular rate for each group of rats.
Fig. 10.
Fig. 10.
Bursting activity in SNc DA cells.a, HRs exhibited a slightly, but significantly, higher percentage of spikes emitted in bursting mode compared with LRs (t111 = −2.00; p< 0.05). Each vertical bar represents the mean ± SEM of each group. b, The scatter plot illustrates the relationship between firing rate and bursting activity. Both HRs and LRs displayed a similar positive correlation between these two factors (for LRs, r = 0.43; p < 0.001; for HRs, r = 0.57; p < 0.001; comparison of the regression slopes between the two groups,p > 0.3). Each point represents an individual cell. Empty circles depict cells from LRs;filled circles are cells from HRs. c, Representative traces of a nonbursting or bursting DA cell are shown.
Fig. 11.
Fig. 11.
Burst events and burst size in SNc DA cells.a, HRs exhibited a higher number of burst events per 10 sec compared with LRs (t111 = −2.42;p < 0.02). b, HRs showed slightly higher burst sizes (number of spikes per burst) compared with LR rats (t111 = −1.70; p = 0.09). Each vertical bar represents the mean ± SEM of each group. c, The distribution of burst size illustrates a large percentage of cells with two-spike bursts in both HRs and LRs.
Fig. 12.
Fig. 12.
Autoreceptor-mediated inhibition of firing in SNc DA cells. a, Cumulative dose–response curves illustrating that the DA D2-class receptor agonist quinpirole induced a dose-dependent decrease in firing activity in both HRs and LRs [dose effect, F(10,190) = 80.4;p < 0.001]. This inhibition was attenuated in HRs compared with LRs [group effect,F(1,19) = 5.3; p < 0.04; group × dose interaction,F(10,190) = 4.1; p< 0.001]. The ANCOVA considering the basal firing rate (quinpirole dose 0) as the covariate [group effect,F(1,18) = 4.1; p = 0.06; group × dose interaction,F(9,171) = 4.5; p< 0.001] indicates that these differences were not entirely caused by difference in basal firing activity. Each pointrepresents the mean ± SEM of each group. b, Representative rate histograms showing examples of recordings from an HR or LR rat. Note the greater doses of quinpirole required to suppress the firing of SNc DA neurons in HR animals compared with LR animals. The effects of quinpirole were reversed by the D2-class receptor antagonist eticlopride (100 μg/kg, i.v.). Arrowheadsindicate the time points at which quinpirole or eticlopride was administered; numbers indicate the infusion dose (in micrograms per kilogram).

Similar articles

Cited by

References

    1. Ackerman JM, White FJ. A10 somatodendritic dopamine autoreceptor sensitivity following withdrawal from repeated cocaine treatment. Neurosci Lett. 1990;117:181–187. - PubMed
    1. Ackerman JM, White FJ. Decreased activity of rat A10 dopamine neurons following withdrawal from repeated cocaine. Eur J Pharmacol. 1992;218:171–173. - PubMed
    1. Aghajanian GK, Bunney BS. Pharmacological characterization of dopamine “autoreceptors” by microiontophoretic single-cell recording studies. Adv Biochem Psychopharmacol. 1977a;16:433–438. - PubMed
    1. Aghajanian GK, Bunney BS. Dopamine “autoreceptors”: pharmacological characterization by microiontophoretic single cell recording studies. Naunyn Schmiedebergs Arch Pharmacol. 1977b;297:1–7. - PubMed
    1. Amini B, Clark JW, Jr, Canavier CC. Calcium dynamics underlying pacemaker-like and burst firing oscillations in midbrain dopaminergic neurons: a computational study. J Neurophysiol. 1999;82:2249–2261. - PubMed

Publication types

MeSH terms