. 2000 Dec 1;20(23):8886-96.
doi: 10.1523/JNEUROSCI.20-23-08886.2000.

Reliability of a fly motion-sensitive neuron depends on stimulus parameters

Affiliations

Reliability of a fly motion-sensitive neuron depends on stimulus parameters

A K Warzecha et al. J Neurosci. .

Abstract

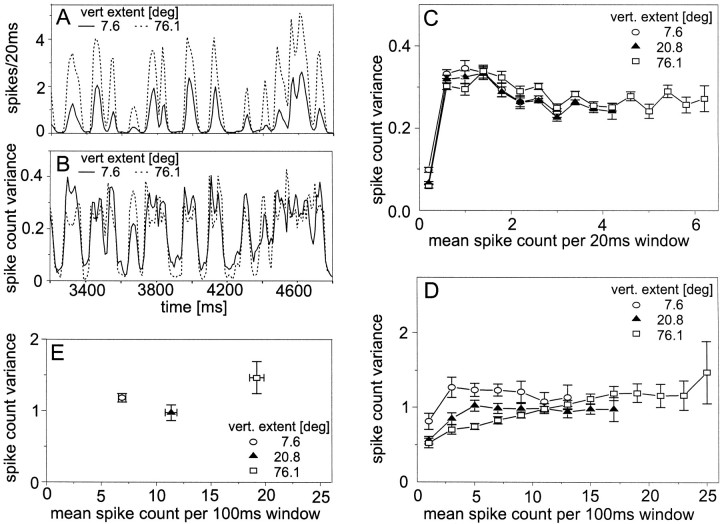
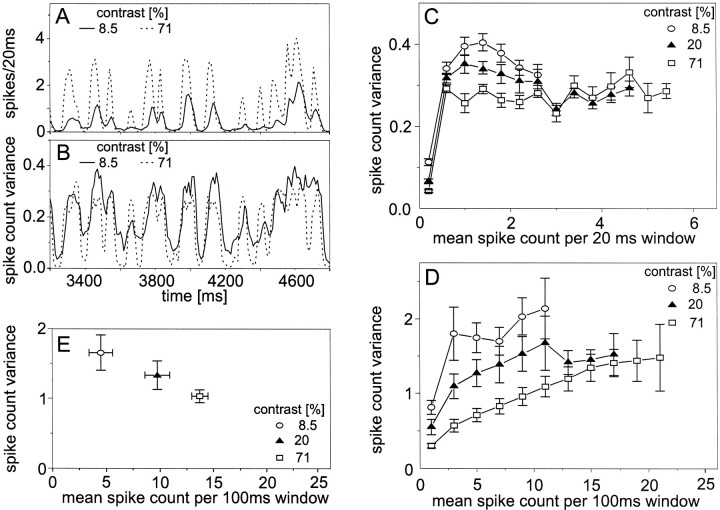
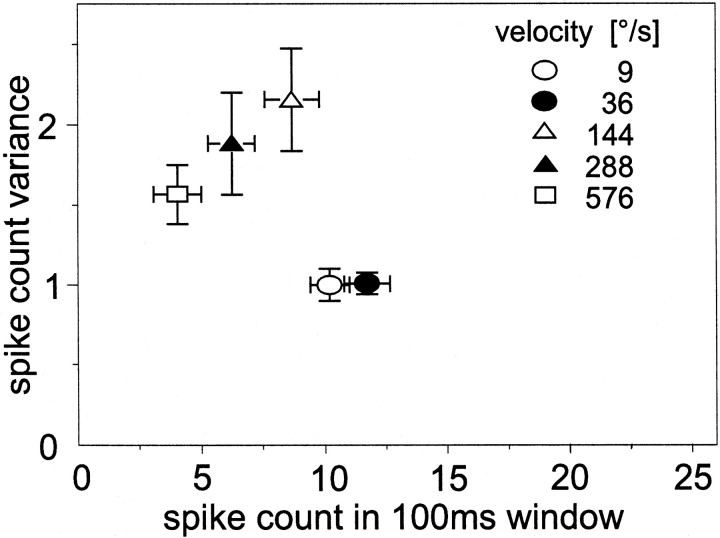
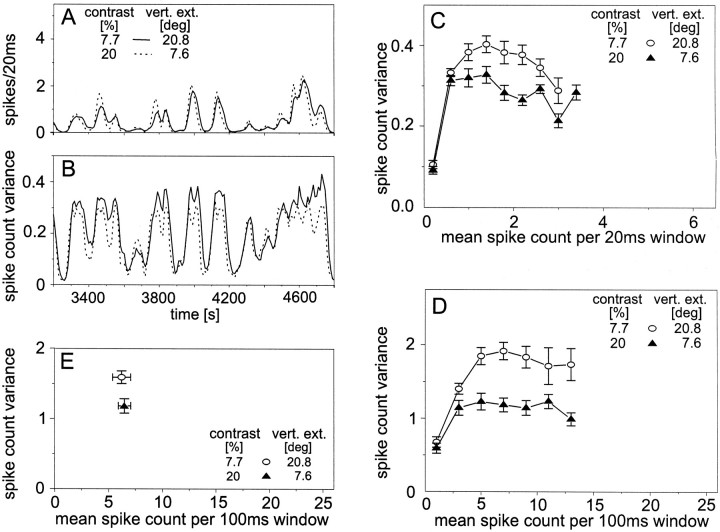
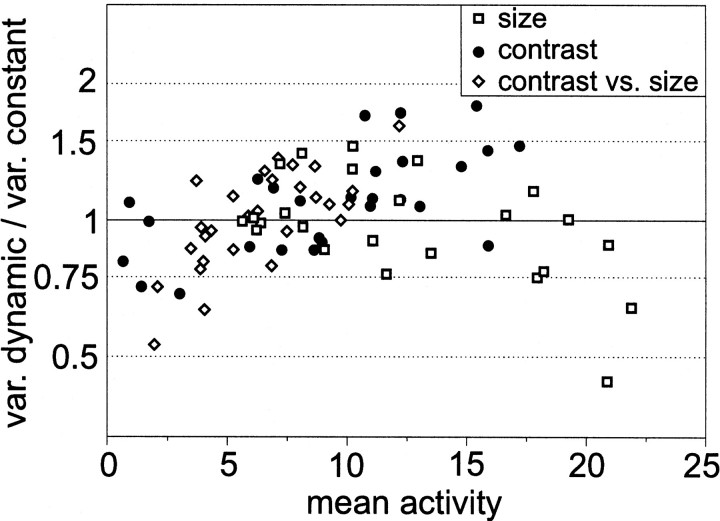
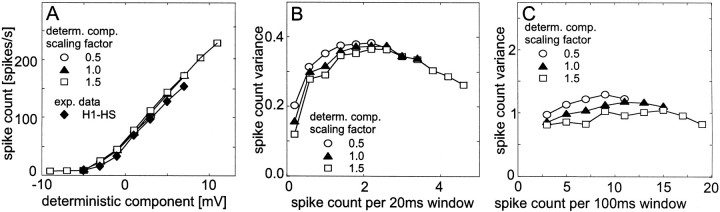
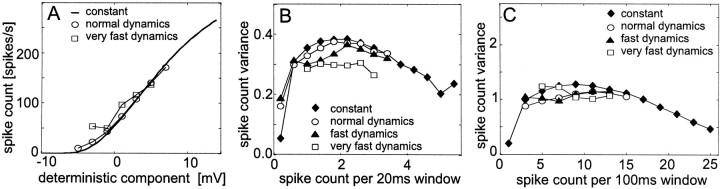
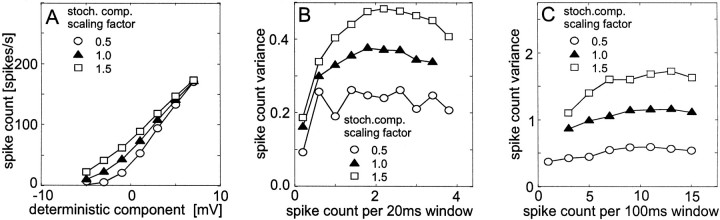
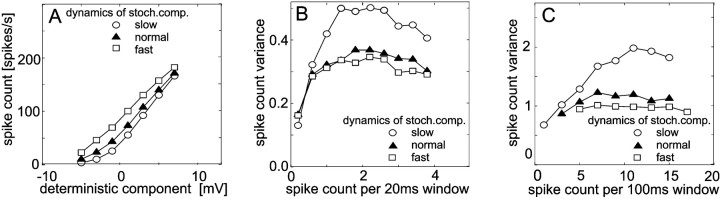
The variability of responses of sensory neurons constrains how reliably animals can respond to stimuli in the outside world. We show for a motion-sensitive visual interneuron of the fly that the variability of spike trains depends on the properties of the motion stimulus, although differently for different stimulus parameters. (1) The spike count variances of responses to constant and to dynamic stimuli lie in the same range. (2) With increasing stimulus size, the variance may slightly decrease. (3) Increasing pattern contrast reduces the variance considerably. For all stimulus conditions, the spike count variance is much smaller than the mean spike count and does not depend much on the mean activity apart from very low activities. Using a model of spike generation, we analyzed how the spike count variance depends on the membrane potential noise and the deterministic membrane potential fluctuations at the spike initiation zone of the neuron. In a physiologically plausible range, the variance is affected only weakly by changes in the dynamics or the amplitude of the deterministic membrane potential fluctuations. In contrast, the amplitude and dynamics of the membrane potential noise strongly influence the spike count variance. The membrane potential noise underlying the variability of the spike responses in the motion-sensitive neuron is concluded to be affected considerably by the contrast of the stimulus but by neither its dynamics nor its size.


Figures

Fig. 1.
Fig. 1.
Response variability of the H1 neuron obtained for the motion of stimulus patterns with variable size. Seeinsets for the vertical extent of the pattern. Altogether, 457 individual response traces of eight H1 cells were analyzed. The mean resting activity was 9.1 spikes/sec. Pattern contrast, 20%. A, Section of the mean time course of responses to band-limited white-noise velocity fluctuations. Spikes were counted in each trial within consecutive time windows of 20 msec time-locked to the onset of motion. Consecutive time windows overlapped by 10 msec. Spike counts in corresponding time bins were averaged across trials. Time 0 denotes the onset of the stimulus.B, Mean time course of the across-trial variance of the spike count obtained within the same section of 20 msec time windows.C, Spike count variance as a function of the mean spike count within 20 msec time windows obtained for band-limited white-noise velocity fluctuations (see Materials and Methods). D, Spike count variance as a function of the mean spike count within 100 msec time windows obtained for band-limited white-noise velocity fluctuations. E, Spike count variance as a function of the mean spike count within 100 msec time windows obtained for constant velocity stimulation. The temporal frequency of pattern motion amounted to 2 Hz. C–E, Error bars denote SEMs across trials.C, D, Although these experiments were made on eight cells, a variable number of cells (4–8) contributed to each data point because not every cell covered the entire activity range.
Fig. 2.
Fig. 2.
Response variability of the H1 neuron obtained for the motion of stimulus patterns with variable contrast. Seeinsets for pattern contrast. Altogether, 530 individual response traces of 9 H1 cells were analyzed. The mean resting activity of the H1 neuron of this sample of flies was 10.1 spikes/sec. Vertical extent of pattern, 20.8°. Data were evaluated in the same way as described in the legend of Figure 1. A, Section of the mean time course of responses to band-limited white-noise velocity fluctuations within 20 msec time windows. B, Mean time course of the across-trial variance of the spike count obtained within the same section of 20 msec time windows. C, Spike count variance as a function of the mean spike count within 20 msec time windows obtained for band-limited white-noise velocity fluctuations.D, Spike count variance as a function of the mean spike count within 100 msec time windows obtained for band-limited white-noise velocity fluctuations. E, Spike count variance as a function of the mean spike count within 100 msec time windows obtained for constant velocity stimulation. The temporal frequency of pattern motion amounted to 2 Hz. C–E, Error bars denote SEMs across cells. C,D, Between four and nine cells contributed to each data point.
Fig. 3.
Fig. 3.
Response variability of the H1 neuron to constant velocity stimuli covering a range from 9 to 576°/sec. The vertical extent of the pattern was 20.8°, and its contrast amounted to 20%. Altogether, 460 individual response traces of eight H1 cells were analyzed. The mean resting activity was 15.3 spikes/sec. Error bars denote SEMs across eight cells.
Fig. 4.
Fig. 4.
Response variability of the H1 neuron obtained for the motion of stimulus patterns with variable contrast and vertical extent. See insets for stimulus conditions. Altogether, 728 individual response traces of 14 H1 cells were analyzed. The mean resting activity was 11.4 spikes/sec. Data were evaluated in the same way as described in the legend of Figure 1. A, Section of the mean time course of responses to band-limited white-noise velocity fluctuations within 20 msec time windows. B, Mean time course of the across-trial variance of the spike count obtained within the same section of 20 msec time windows.C, Spike count variance as a function of the mean spike count within 20 msec time windows obtained for band-limited white-noise velocity fluctuations. To test whether the differences in the spike count variances are significant, a two-factor ANOVA was applied. The ANOVA was done for two subsets of the data because not all cells contributed to the large activity classes. Subset 1 contained the four smallest activity classes and 14 cells; subset 2 contained the eight smallest activity classes and six cells. The spike count variances for the large low-contrast pattern are significantly larger for both subsets (p < 0.01). D, Spike count variance as a function of the mean spike count within 100 msec time windows obtained for white-noise velocity fluctuations. As inC, a two-factor ANOVA was applied to two subsets of the data. Subset 1 contained the three smallest activity classes and 14 cells; subset 2 contained the seven smallest activity classes and five cells. The spike count variances for the large low-contrast pattern are significantly larger for both subsets (p < 0.01). E, Spike count variance as a function of the mean spike count within 100 msec time windows obtained for constant velocity stimulation. The temporal frequency amounted to 2 Hz. The spike count variance for the large low-contrast pattern is significantly larger than the spike count variance for the small high-contrast pattern (t test; p < 0.01).C–E, Error bars denote SEMs across cells.C, D, Between 4 and 14 cells contributed to each data point.
Fig. 5.
Fig. 5.
Variability between different H1 cells and stimulus conditions. The quotient between the mean spike count variance for dynamical and that for constant velocity stimulation is plotted as a function of the mean spike count during constant stimulation. The mean spike count and its variance during constant velocity stimulation were evaluated within 100 msec time windows for each cell and stimulus condition separately, as described in Materials and Methods. To obtain the mean spike count variances for dynamic stimulation, only those 100 msec time windows were taken into account for which the mean activity fell into the same activity range that was covered by constant velocity stimulation. The largest (smallest) mean spike count variance contributing to the figure amounted to 3.14 spikes2/100 msec (0.56 spikes2/100 msec) for constant stimulation and to 2.70 spikes2/100 msec (0.68 spikes2/100 msec) for dynamical stimulation. Data are part of those used for Figures 1, 2, and 4. Symbolsindicate the different data sets. For each cell, two or three data points (depending on the data set) are shown, which were obtained by the different stimulus conditions.
Fig. 6.
Fig. 6.
Dependence of the response properties of a simulated spiking neuron on the amplitude of the deterministic membrane potential component. The deterministic component scaled with a factor of 1 corresponds to the unaltered membrane potential fluctuations of a tangential cell to dynamic motion stimulation averaged across 100 trials. It lasted for 2960 msec. A membrane potential of 0 mV corresponds to the resting potential of the tangential cell. The amplitude of the deterministic membrane potential component was increased and decreased by 50% (see insets). The stochastic membrane potential component was fitted to the experimental data (see Materials and Methods). The mean spike count and the spike count variance were determined across 500 individual response traces for each input condition. A, Dependence of the spike count on the deterministic membrane potential component for simulated and experimentally determined data (see inset). Note that different symbols superimpose. The mean deterministic component and the mean spike count were determined in 20 msec time windows. The mean deterministic membrane potential was assigned to activity classes with a width of 2 mV. Spike counts were averaged if the corresponding mean membrane potential fell into the same activity class. For the experimental data, 100 responses from an H1 neuron were evaluated. The neuron was stimulated with the same dynamic motion fluctuations as the HS cell used to determine the deterministic response component of the membrane potential. In another recording (data not shown), the mean spike count for each activity class of the membrane potential was slightly larger than that of the model cell. B, Spike count variance as a function of the mean spike count within 20 msec time windows. As for the experimental data (see Materials and Methods), the mean spike count was assigned to activity classes with a width of 0.4 spikes per time window. Spike count variances were averaged if the corresponding mean spike count fell into the same activity class. C, Spike count variance as a function of the mean spike count within 100 msec time windows. Consecutive time windows overlapped by 90 msec. The mean spike count was assigned to activity classes with a width of two spikes per time window. Spike count variances were averaged if the corresponding mean spike count fell into the same activity class.
Fig. 7.
Fig. 7.
Dependence of the responses of a simulated spiking neuron on the dynamics of the deterministic component of membrane potential. To obtain the constant deterministic component, the membrane potential was set to constant values. To cover the entire response range of a tangential cell, this value was increased in steps of 0.5 mV in subsequent simulations. The deterministic component with normal dynamics was obtained from averaging 100 responses of a tangential cell to band-limited white-noise velocity fluctuations (the same as used for Fig. 6). Faster dynamics were obtained by compressing the time scale of the deterministic membrane potential component by a factor of 2 (fast dynamics) or by a factor of 4 (very fast dynamics). Therefore, the duration of the membrane potential fluctuations that were fed into the model and the corresponding sequences of spike trains were reduced from 2960 msec (normal dynamics) to either 1480 msec (fast dynamics) or 740 msec (very fast dynamics). The parameters of the stochastic component were fitted to the experimental data. Data evaluation and conventions as described in the legend of Figure 6. For the dynamical membrane potential fluctuations, the mean spike count and the spike count variance were determined across 500 individual response traces for each condition, for the constant membrane potential; 200 response traces were taken. A, Dependence of the spike count on the deterministic component of the membrane potential. B, Spike count variance as a function of the mean spike count within 20 msec time windows. C, Spike count variance as a function of the mean spike count within 100 msec time windows.
Fig. 8.
Fig. 8.
Dependence of the responses of a simulated spiking neuron on the amplitude of the stochastic component of the membrane potential. The stochastic component scaled by a factor of 1 was derived from experimental data. To investigate the influence of the amplitude of the stochastic membrane potential component, it was increased or decreased by 50% (see insets). The deterministic component was obtained from a tangential cell during stimulation with band-limited white-noise velocity fluctuations (the same as used for Fig. 6). Data evaluation and conventions are as described in the legend of Figure 6. A, Dependence of the spike count on the deterministic component of the membrane potential. B, Spike count variance as a function of the mean spike count within 20 msec time windows. C, Spike count variance as a function of the mean spike count within 100 msec time windows.
Fig. 9.
Fig. 9.
Dependence of the responses of a simulated spiking neuron on the dynamics of the stochastic component of the membrane potential. The stochastic component with normal dynamics was fitted to experimental data. Faster or slower dynamics of the stochastic membrane potential component were obtained by compressing (fast dynamics) or dilating (slow dynamics) the time scale of the stochastic component by a factor of 2. The deterministic component of the membrane potential was obtained from averaging 100 responses of a tangential cell to band-limited white-noise velocity fluctuations (the same as used for Fig. 6). It lasted for 2960 msec. Data evaluation and conventions are as described in the legend of Figure 6. A, Dependence of the spike count on the deterministic component of the membrane potential. B, Spike count variance as a function of the mean spike count within 20 msec time windows. C, Spike count variance as a function of the mean spike count within 100 msec time windows.

Similar articles

Cited by

References

    1. Azouz R, Gray CM. Cellular mechanisms contributing to response variability of cortical neurons in vivo. J Neurosci. 1999;19:2209–2223. - PMC - PubMed
    1. Azouz R, Gray CM. Dynamic spike threshold reveals a mechanism for synaptic coincidence detection in cortical neurons in vivo. Proc Natl Acad Sci USA. 2000;97:8110–8115. - PMC - PubMed
    1. Barberini CL, Horwitz GD, Newsome WT. A comparison of spiking statistics in motion sensing neurons of flies and monkeys. In: Zanker JM, Zeil J, editors. Computational, neural and ecological constraints of visual motion processing. Springer; Berlin: 2000. pp. 307–320.
    1. Berry MJ, Meister M. Refractoriness and neural precision. J Neurosci. 1998;18:2200–2211. - PMC - PubMed
    1. Berry MJ, Warland DK, Meister M. The structure and precision of retinal spike trains. Proc Natl Acad Sci USA. 1997;94:5411–5416. - PMC - PubMed

Publication types

LinkOut - more resources