Clinical Trial
. 2000 Dec 1;20(23):8916-24.
doi: 10.1523/JNEUROSCI.20-23-08916.2000.

Learning of visuomotor transformations for vectorial planning of reaching trajectories

Affiliations
Clinical Trial

Learning of visuomotor transformations for vectorial planning of reaching trajectories

J W Krakauer et al. J Neurosci. .

Abstract

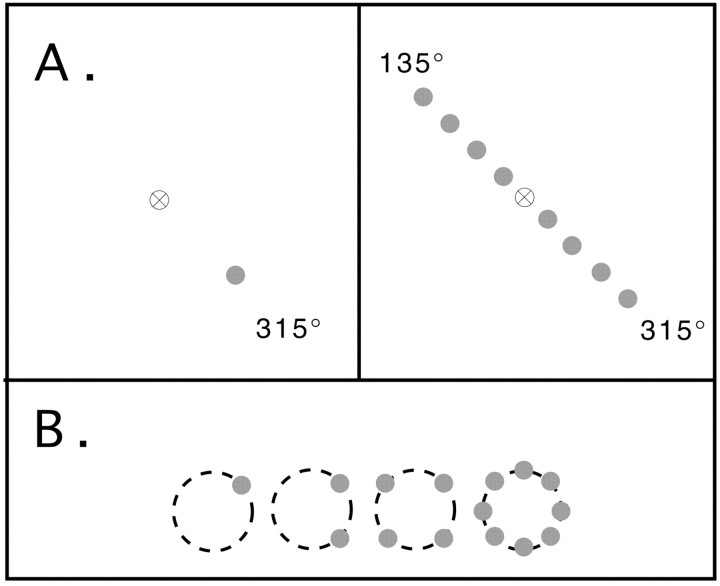
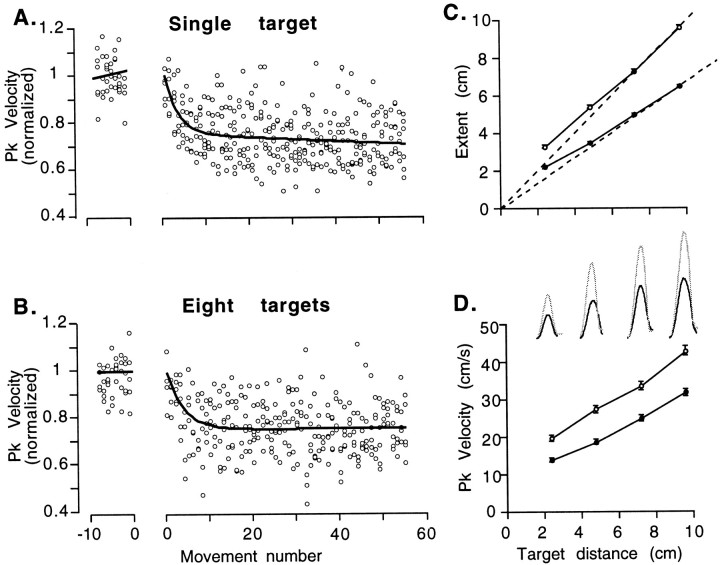
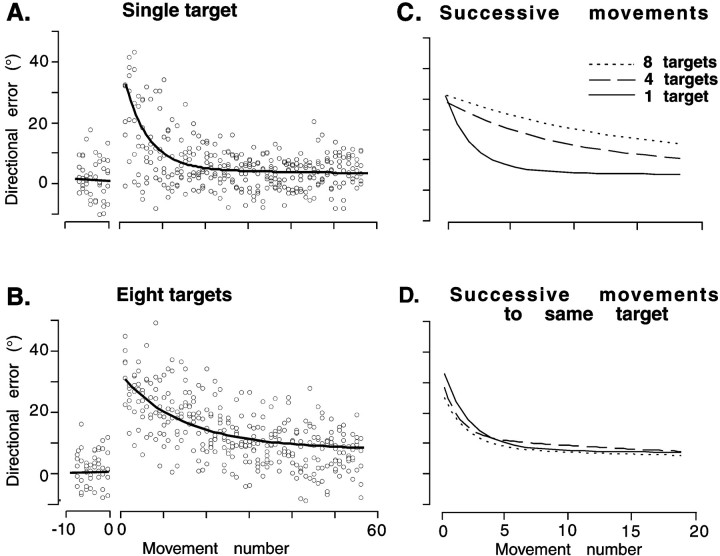
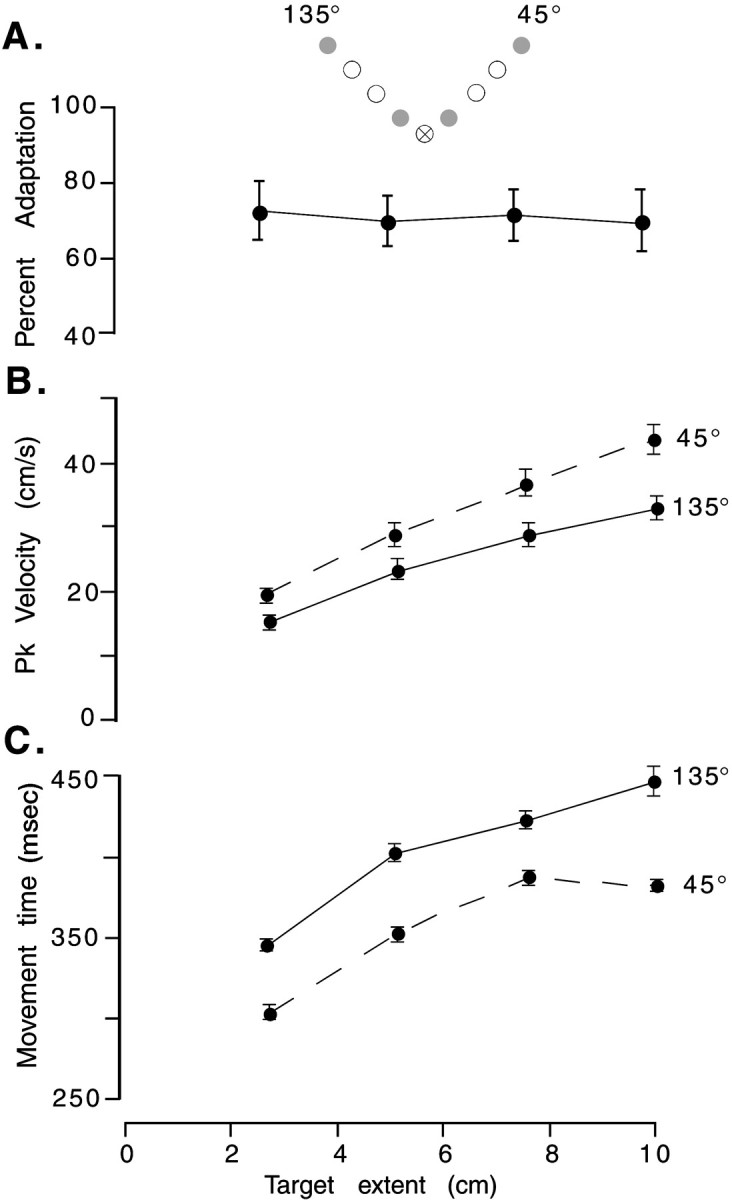
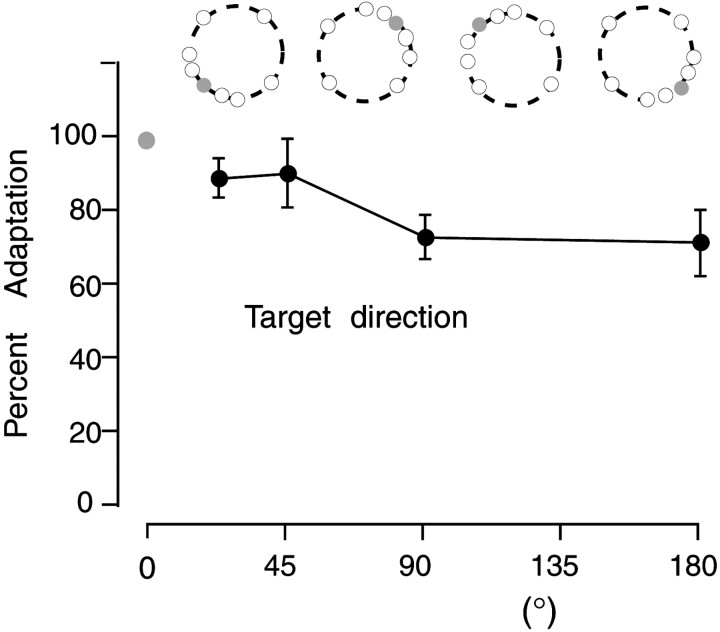
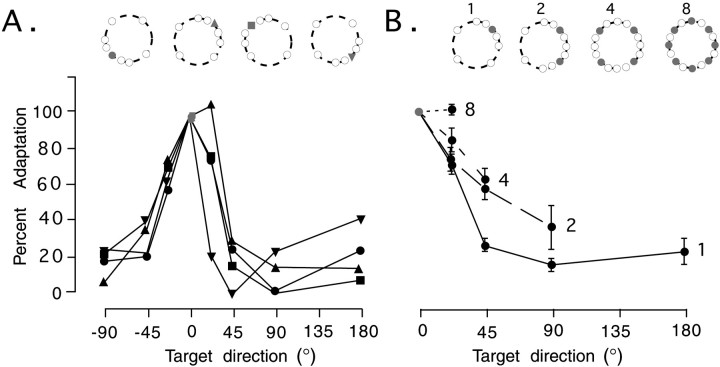
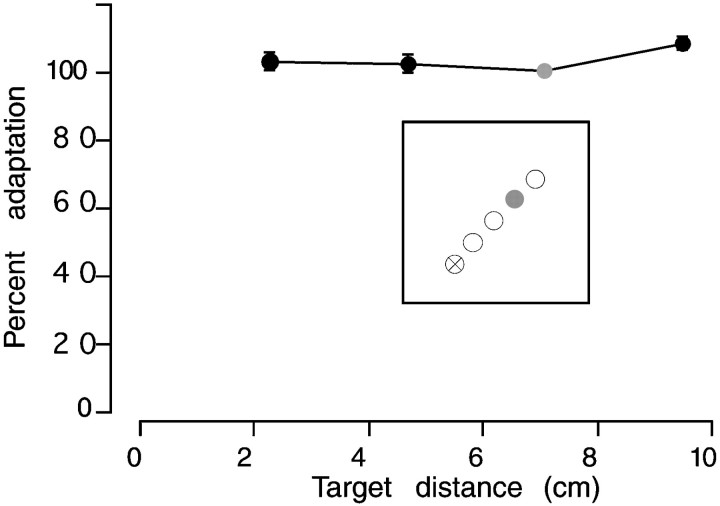
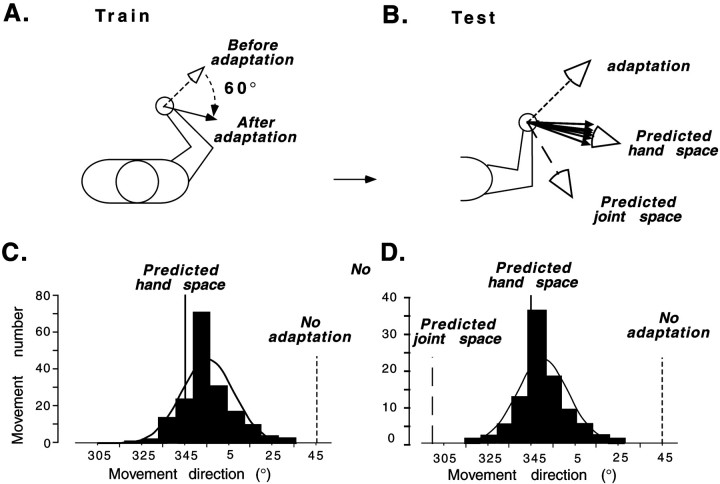
The planning of visually guided reaches is accomplished by independent specification of extent and direction. We investigated whether this separation of extent and direction planning for well practiced movements could be explained by differences in the adaptation to extent and directional errors during motor learning. We compared the time course and generalization of adaptation with two types of screen cursor transformation that altered the relationship between hand space and screen space. The first was a gain change that induced extent errors and required subjects to learn a new scaling factor. The second was a screen cursor rotation that induced directional errors and required subjects to learn new reference axes. Subjects learned a new scaling factor at the same rate when training with one or multiple target distances, whereas learning new reference axes took longer and was less complete when training with multiple compared with one target direction. After training to a single target, subjects were able to transfer learning of a new scaling factor to previously unvisited distances and directions. In contrast, generalization of rotation adaptation was incomplete; there was transfer across distances and arm configurations but not across directions. Learning a rotated reference frame only occurred after multiple target directions were sampled during training. These results suggest the separate processing of extent and directional errors by the brain and support the idea that reaching movements are planned as a hand-centered vector whose extent and direction are established via learning a scaling factor and reference axes.


Figures

Fig. 1.
Fig. 1.
Target arrays for time course of learning experiment. A, One (left) and eight (right) training targets for gain learning. Thecrossed circle indicates the start position, and the targets are in gray. The targets werecircular and were spaced at 2.4, 4.8, 7.2, and 9.6 cm from the starting position in both 135 and 315° directions. Single-target training was to the 7.2 cm target. B, One, two, four, and eight training targets for rotation learning. The targets were arrayed in a circle of radius 4.2 cm.
Fig. 2.
Fig. 2.
Gain learning. The last 8 movements of the baseline block are shown followed by 56 consecutive movements at gain 1.5. Each plot shows group data. A, Learning curve for gain training to a single target. B, Learning curve for gain training to eight targets. C, The relationship between mean movement extent and target distance at a gain of 1 (open circles) and a gain of 1.5 (filled circles). The dashed lines represent accurate performance at the two gains. The movement extents closely matched the target distances except for the smallest movements, which were somewhat hypermetric. D, The relationship between mean peak velocity and target distance. The outward trajectories had stereotypical single-peaked velocity profiles that scaled with target distance (inset). It may be noted that thelines fitting the peak velocities at the four target distances do not intercept the y-axis at zero. This was not investigated specifically but may represent either a range effect or an intrinsic nonlinearity in programming of small but rapidly rising force impulses (Gordon and Ghez, 1987).
Fig. 3.
Fig. 3.
Rotation learning. Learning was measured by the progressive reduction in the directional error at the peak velocity. The last 8 movements of the baseline block are shown followed by 56 consecutive movements with the 30° CCW rotation. Each plot shows group data. A, Learning curve for rotation learning to a single target. B, Learning curve for rotation learning to eight targets. C, Learning curves for rotation learning with single, four, and eight targets, plotted for the first 18 moves of the training block. D, Learning curves for rotation learning plotted for consecutive moves to a single target for single-, four-, and eight-target training.
Fig. 4.
Fig. 4.
Gain generalization across multiple target distances. A, Bottom, The plot is of mean (±SEM) group data showing the percent adaptation to untrained target distances relative to adaptation to the training targets. The data are collapsed for the four different training targets.Top, The four different training targets (circles) are shown in gray, and the testing targets are in white. On any given training day only one of the gray targets was trained to, and the remaining seven targets were used for testing. B, Mean peak velocity for the untrained targets is plotted against target distance in the two testing directions. C, Mean movement time for the untrained targets is plotted against target distance in the two testing directions.
Fig. 5.
Fig. 5.
Gain generalization across multiple directions after training in a single direction. Bottom, The plot is of mean (±SEM) group data showing the percent adaptation to untrained directions relative to the training target.Top, The gray targets show the four different target directions for 4 different training days. The testing targets are in white.
Fig. 6.
Fig. 6.
Rotation generalization. A, Generalization across multiple directions after training in a single direction. The directional data are relative to the training target.Bottom, The plot is of mean (±SEM) group data showing the percent adaptation to untrained directions relative to the training target. Top, The four different training directions (45, 135, 225, and 315°) for 4 different days are shown by the gray symbols. The positioning of the testing targets (in white) is shown. B, Generalization across multiple directions after training in one, two, four, and eight directions. Bottom, The plot is of mean (±SEM) group data showing the relative percent adaptation in the untrained directions relative to the trained directions. When there was more than one training target, the mean performance to all the training targets was used to calculate the relative adaptation in untrained directions. Data were collapsed for clockwise and counterclockwise directions.Top, Training targets are shown in gray, and testing targets are in white.
Fig. 7.
Fig. 7.
Rotation generalization across multiple target distances after training to a single distance of 7.2 cm. The plot shows mean (±SEM) group data of the percent adaptation to untrained distances 2.4, 4.8, and 9.6 cm relative to the training distance.Inset, The target array is shown with the training target in gray.
Fig. 8.
Fig. 8.
Schematic of experimental paradigm.A, Training configuration: shoulder at 45° and elbow at 90°. The arrows indicate the hand directions before and after adaptation with a 60° CCW rotation. B, Testing configuration: shoulder at 90° and elbow at 90°. Thelarge arrows in the test configuration indicate the predicted hand directions if adaptation were absent (top), if learning were in joint space (bottom), or if learning were in extrinsic space (middle). The smaller filled arrows show the actual mean movement direction for each subject. C, Cumulative histogram of the direction of all movements to the 45° target for all subjects in the training configuration. D, Cumulative histogram of the direction of all movements to the 45° target direction for all subjects in the testing configuration.
Fig. 9.
Fig. 9.
A scatter plot of the elbow versus shoulder angle change for the training and testing configurations for all six subjects. The filled circles represent the training configuration, and the open circles represent the testing configuration.

Similar articles

Cited by

References

    1. Bedford F. Perceptual and cognitive spatial learning. J Exp Psychol Hum Percept Perform. 1993;49:517–530. - PubMed
    1. Bock O. Adaptation of aimed arm movements to sensorimotor discordance: evidence for direction-independent gain control. Behav Brain Res. 1992;51:41–50. - PubMed
    1. Bock O. Scaling of joint torque during planar arm movements. Exp Brain Res. 1994;101:346–352. - PubMed
    1. Bock O, Burghoff M. Visuo-motor adaptation: evidence for a distributed amplitude control system. Behav Brain Res. 1997;89:267–273. - PubMed
    1. Carrozzo M, McIntyre J, Zago M, Lacquaniti F. Viewer-centered and body-centered frames of reference in direct visuomotor transformations. Exp Brain Res. 1999;129:201–210. - PubMed

Publication types

LinkOut - more resources