

Diffusion tensor MR imaging of the brain: effect of diffusion weighting on trace and anisotropy measurements
- PMID: 11110532
- PMCID: PMC7974303
Diffusion tensor MR imaging of the brain: effect of diffusion weighting on trace and anisotropy measurements
Abstract
Background and purpose: In human brain, the relationship between MR signal and b value is complicated by cerebral perfusion, restricted diffusion, anisotropy, cellular membrane permeability, and active cellular transport of water molecules. Our purpose was to evaluate the effect of the number and strength of diffusion-sensitizing gradients on measured isotropic apparent diffusion coefficients (ADCi), fractional anisotropy (FA), and their respective SD in different anatomic locations of the brain.
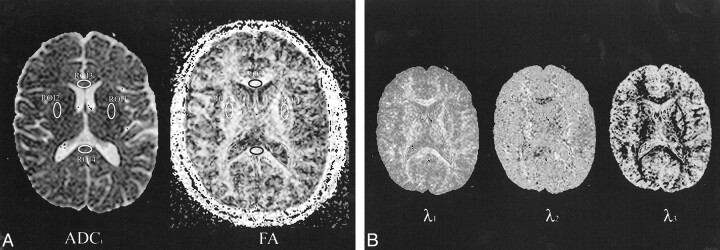
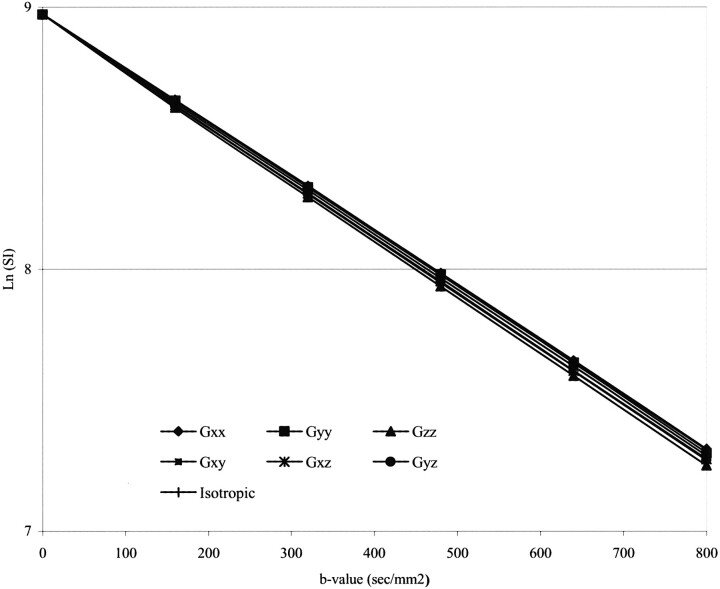
Methods: Quantitative apparent diffusion coefficients and diffusion anisotropy brain maps were obtained from 10 healthy volunteers by using six different levels of diffusion weighting (b0 = 0, bl = 160, b2 = 320, b3 = 480, b4 = 640, and b5 = 800 s/mm2), applied sequentially in six different directions (Gxx, Gyy, Gzz, Gxy, Gxz, Gyz) and coupled to a single-shot spin-echo echo-planar (2,045/115 [TR/TE]) MR imaging technique. ADCi, FA, eigenvalues (lambda1, lambda2, lamdba3)1 of the principal eigenvectors, and their respective SD were measured from seven different anatomic locations in the brain. Repeated measures analysis of variance was used to evaluate for the existence of significant differences in the average and SD of the calculated ADCi and FA as a function of the number and strength of b values. When a difference existed, the Bonferroni t method was used for paired comparisons of the groups.
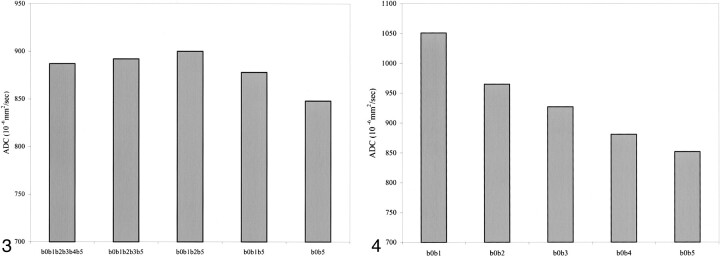
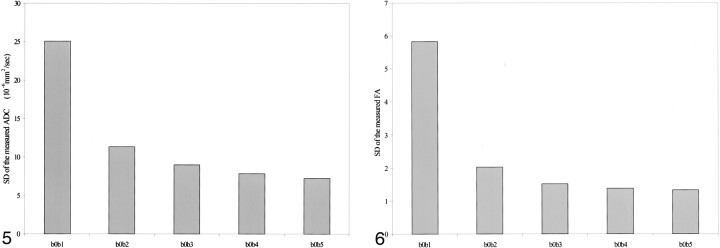
Results: The measured ADCi was affected by the number and strength of b values (P < .05). The SD of the ADCi was affected by the strength (P < .05) but not the number of b values (P > .05). The measured FA was unaffected by the number and strength of b values (P > .05). The SD was affected by the number and strength of b values (P < .05).
Conclusion: The number and strength of b values do influence measures of diffusion and anisotropy. Attention to the choice of diffusion sensitization parameters is important in decisions regarding clinical feasibility (acquisition time) and normative measures.
Figures
Comment in
-
Diffusing into the future.AJNR Am J Neuroradiol. 2000 Nov-Dec;21(10):1780-2. AJNR Am J Neuroradiol. 2000. PMID: 11110526 Free PMC article. No abstract available.
References
-
- Mintorovitch J, Moseley ME, Chileuitt L, Shimizu H, Cohen Y, Weinstein PR. Comparison of diffusion- and T2-weighted MRI for the early detection of cerebral ischemia and reperfusion in rats. Magn Reson Med 1991;18:39-50 - PubMed
-
- Minematsu K, Li L, Fisher M. Sotak CH, Davis MA, Fiandaca MS. Diffusion-weighted magnetic resonance imaging: rapid and quantitative detection of focal brain ischemia. Neurology 1992;42:235-240 - PubMed
-
- Warach S, Chien D, Li W, Ronthal M, Edelmann RR. Fast magnetic resonance diffusion-weighted imaging of acute human stroke. Neurology 1992;42:1717-1723 - PubMed
-
- van Gelderen P, de Vleeschouwer MHM, DesPres D, Pekar J, van Zijl PCM, Moonen CTW. Water diffusion and acute stroke. Magn Reson Med 1994;31:154-163 - PubMed
MeSH terms
LinkOut - more resources
Full Text Sources
Medical