. 2000 Nov-Dec;21(10):1821-9.

High-b-value diffusion-weighted MR imaging of suspected brain infarction

Affiliations

High-b-value diffusion-weighted MR imaging of suspected brain infarction

J R Meyer et al. AJNR Am J Neuroradiol. 2000 Nov-Dec.

Abstract

Background and purpose: Recent technological advances in MR instrumentation allow acquisition of whole-brain diffusion-weighted MR scans to be obtained with b values greater than 1,000. Our purpose was to determine whether high-b-value diffusion-weighted MR imaging improved contrast and detection of signal changes in acute and chronic brain infarction.

Methods: We prospectively evaluated the MR scans of 30 subjects with a history of possible brain infarction on a 1.5-T MR imager with 40 mT/meter gradients (slew rate 150 T/m/s) by use of the following single-shot echo-planar diffusion-weighted MR sequences: 1) 7,999/ 71.4/1 (TR/TE/excitations, b = 1,000; 2) 999/ 88.1/3, b = 2,500; and 3) 7,999/ 92.1/4, b = 3,000. Diffusion-weighted MR imaging was performed in three orthogonal directions during all sequences. All subjects were scanned with fast fluid-attenuated inversion recovery (FLAIR) (10,006/145/2,200/1 [TR/TE/TI/excitations]) and fast spin-echo T2-weighted (3,650/95/3 [TR/TE/excitations], echo train length, 8). The diagnosis of brain infarction was established by clinical criteria.

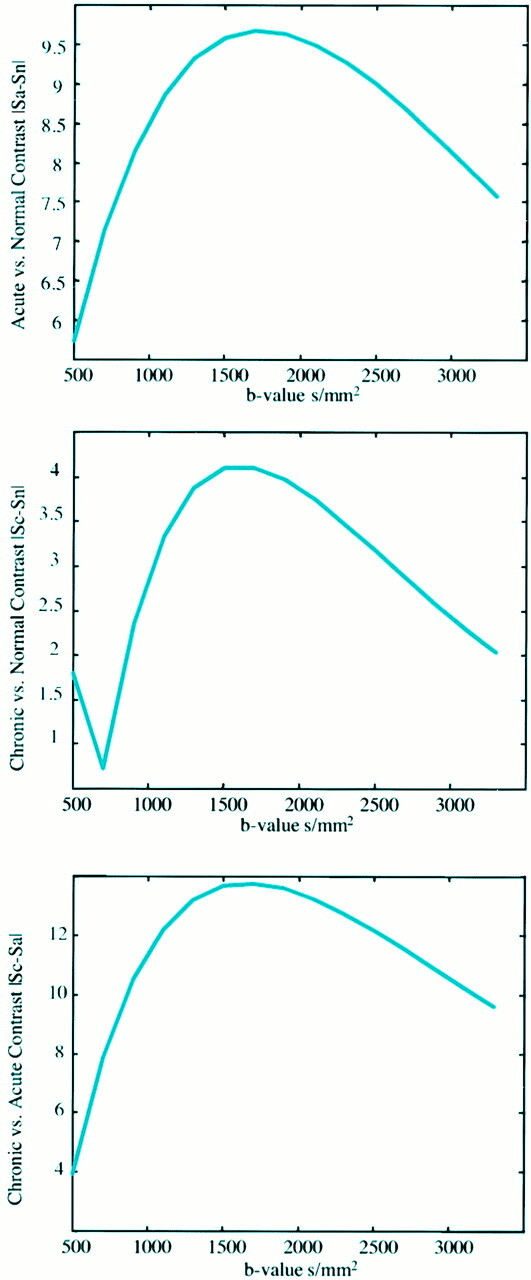
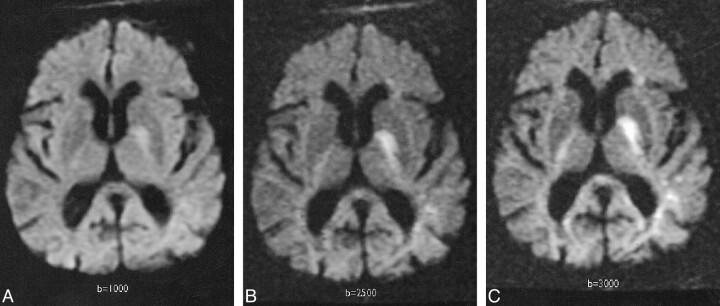
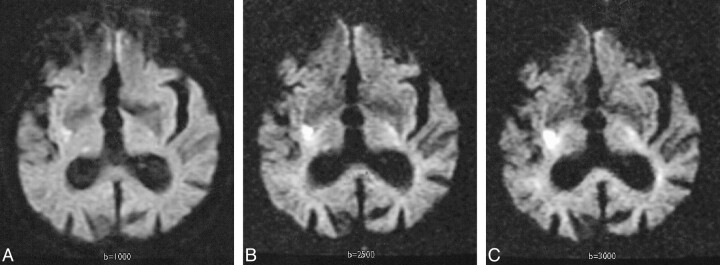
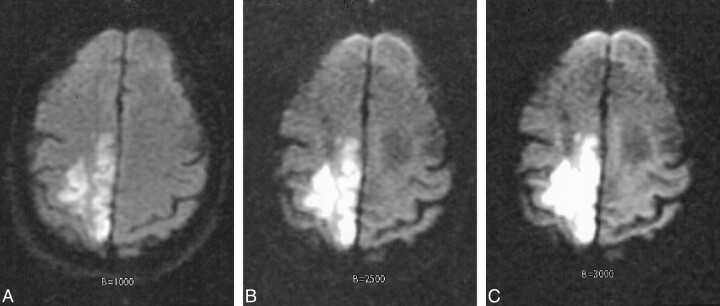
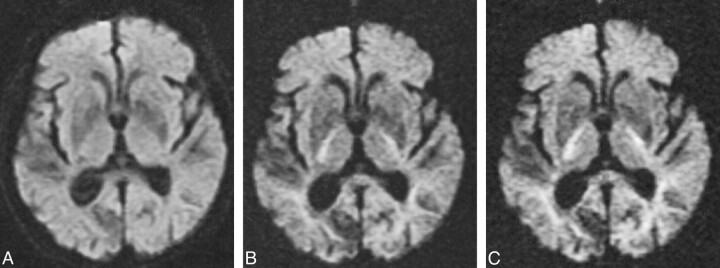
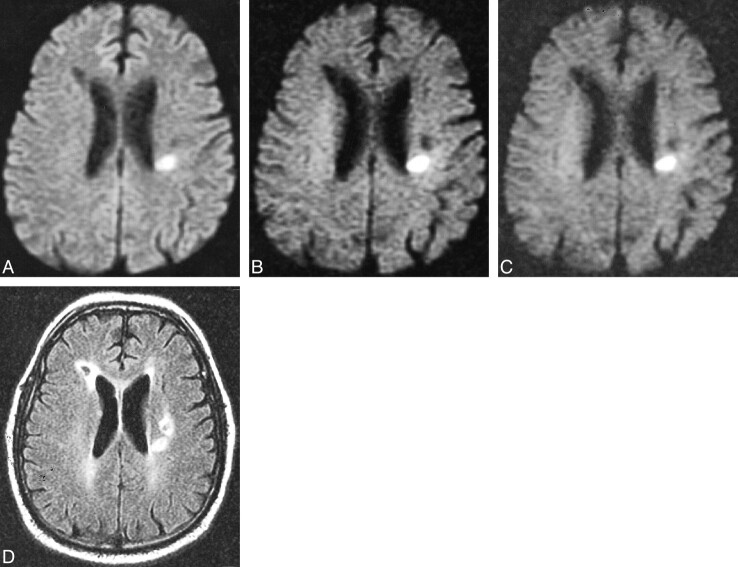
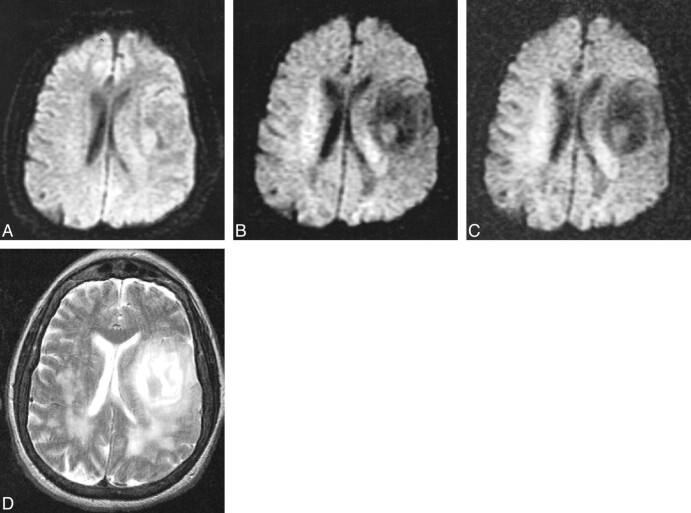
Results: Twenty women and 10 men with a mean age of 67.7 years were enrolled in the study. One subject was excluded owing to poor image quality. Twelve of 29 subjects had a clinical diagnosis of acute infarction. All 12 had lesions that were hyperintense on diffusion-weighted images at all three b values; five were cortical and seven subcortical. There was increased contrast of all lesions on high-b-value scans (b = 2,500 and 3,000). Lesions that were hypointense on diffusion-weighted images were identified and evaluated at the three different b values. At b = 1,000, there were 19 hypointense lesions, whereas at b = 2,500 and 3,000 there were 48 and 55 lesions, respectively. On FLAIR and T2-weighted images, these low-signal lesions were predominantly chronic, subcortical, ischemic lesions and lacunar infarcts, but four chronic cortical infarcts, one porencephalic cyst, and one primary brain tumor were also found. Low-signal lesions were also noted to have increased contrast on high-b-value diffusion-weighted scans.

Conclusion: High-b-value diffusion-weighted MR imaging (b = 2,500 or b = 3,000) had no impact on diagnosis of acute infarction. High-b-value diffusion-weighted MR imaging (b = 2,500) combined with diffusion-weighted MR imaging at b = 1,000 improves tissue characterization by increasing the spectrum of observed imaging abnormalities in patients with suspected brain infarction.


Figures

<sc>fig</sc> 1.
fig 1.
The signal intensity difference between three tissue types (normal gray matter tissue [assumed ADC = 0.8 × 10⁻³ mm2/s, T2 = 100 ms], acute ischemic tissue [decreased ADC = 0.4 × 10⁻³ mm2/s, T2 = 100 ms], and chronic lesions [elevated ADC = 1.3 × 10⁻³ mm2/s, elevated T2 = 100 ms]) plotted as a function of the b value. In addition to the ADC and T2 assumptions for each tissue, the tissue T1s were assumed to be equal (1000 ms) and significantly smaller than the imaging TR (10 s) such that T1 effects could be ignored. A, The signal difference in normal gray matter tissue and acute lesion is shown. B, Normal tissue signal is compared with chronic lesion signal, assuming the T2 and ADC are elevated in the chronic lesion. C, The relative signal difference between acute and chronic lesion signal is demonstrated. In each case, the contrast reaches a maximum in the b-value range of 1500–2000 s/mm2. Note, however, that the largest contrast is seen in C (acute vs chronic), suggesting that higher b values may be beneficial in delineating chronically infarcted versus acutely ischemic regions.
<sc>fig</sc> 2.
fig 2.
Trace image of hyperacute infarct in an 89-year-old woman scanned 6 hours after developing right-sided weakness and aphasia. A, Diffusion-weighted image (b = 1000 s/mm2) demonstrates a high-signal area consistent with acute infarct in the left basal ganglia and posterior limb of the internal capsule. B, Diffusion-weighted image (b = 2500 s/mm2) demonstrates the increased contrast of the high-signal lesion. C, Diffusion-weighted image (b = 3000 s/mm2) also demonstrates this lesion more clearly than at b = 1000; anisotropic effects are evident in the posterior periventricular regions.
<sc>fig</sc> 3.
fig 3.
Acute infarct in an 82-year-old man scanned at 22 hours. A, Diffusion-weighted image with b = 1000 s/mm2 demonstrates a high-signal area consistent with acute infarct in the right basal ganglia along the posterior lenticular nucleus. The posterior horns of the lateral ventricles are prominent. B, Diffusion-weighted image at b = 2500 s/mm2 demonstrates the high-signal lesion with greater contrast. C, Diffusion-weighted image at b = 3000 s/mm2 also demonstrates this lesion more clearly than at b = 1000; anisotropic effects are evident in the contralateral internal capsule and corona radiata.
<sc>fig</sc> 4.
fig 4.
Acute infarct in a 94-year-old woman scanned 12 hours after developing left-sided hemiparesis. A, Diffusion-weighted image with b = 1000 s/mm2 demonstrates a high-signal area consistent with acute infarct in the right parietal lobe. B, Diffusion-weighted image at b = 2500 s/mm2 demonstrates the high-signal lesion with greater contrast. C, Diffusion-weighted image at b = 3000 s/mm2 also demonstrates this high-signal lesion more clearly than at b = 1000.
<sc>fig</sc> 5.
fig 5.
Transient ischemic attack and chronic infarct in a 90-year-old woman with a remote history of cerebral infarct, scanned 2 hours after developing right-sided weakness and left-sided facial droop. Her symptoms resolved spontaneously within 11 hours. A, Diffusion-weighted image with b = 1000 s/mm2 negative for acute infarcts, though a low-signal area of increased diffusion, consistent with chronic infarct, is noted in the right occipital lobe. B, Diffusion-weighted image at b = 2500 s/mm2 demonstrates the low-signal lesion with greater contrast. C, Diffusion-weighted image at b = 3000 s/mm2 also demonstrates this lesion more clearly than at b = 1000.
<sc>fig</sc> 6.
fig 6.
Acute and chronic infarcts. A, Diffusion-weighted image with b = 1000 s/mm2 demonstrates a high-signal lesion, consistent with acute infarct in the left corona radiata, and a low-signal area in the right periventricular white matter (arrow), consistent with a chronic infarct. A second low-signal lesion is seen anterior to the high-signal area in the left subcortical white matter. B, Diffusion-weighted image at b = 2500 s/mm2 shows increased contrast of the high-signal and two low-signal lesions. C, Diffusion-weighted image at b = 3000 s/mm2 also demonstrates the high- and low-signal areas more conspicuously than at b = 1000. D, FLAIR image demonstrating the encephalomalacia and reactive gliosis associated with the two chronic strokes seen as low-signal lesions on a diffusion-weighted image, and increased signal in the lesion seen as high signal on a diffusion-weighted image.
<sc>fig</sc> 7.
fig 7.
Primary brain tumor in a 72-year-old woman scanned 30 hours after developing aphasia and slurred speech. A, Diffusion-weighted image with b = 1000 s/mm2 is negative for acute infarcts, but an isointense irregularity of the cortical sulci is noted along the left sylvian fissure. B, Diffusion-weighted image at b = 2500 s/mm2 demonstrates a large low-signal lesion along the left sylvan fissure and in white matter posterior to the posterior horns of the lateral ventricles, representing increased diffusion that was not appreciated at b = 1000. C, Diffusion-weighted image at b = 3000 s/mm2 also demonstrates these low-signal lesions not seen at b = 1000. D, Fast spin-echo T2-weighted image reveals a high signal along the left sylvian fissure and posterior to the posterior lateral ventricles, corresponding to the low-signal lesions seen on the diffusion-weighted images at b = 2500 and b = 3000. Stereotactic biopsy confirmed the large lesion to be an oligostrocytoma.

Comment in

  • Diffusing into the future.
    Sze G, Anderson A. Sze G, et al. AJNR Am J Neuroradiol. 2000 Nov-Dec;21(10):1780-2. AJNR Am J Neuroradiol. 2000. PMID: 11110526 Free PMC article. No abstract available.

References

    1. Lovblad KO, Laubach HJ, Baird AE, et al. Clinical experience with diffusion-weighted MR in patients with acute stroke. AJNR Am J Neuroradiol 1998;19:1061-1066 - PMC - PubMed
    1. Benveniste H, Johnson GA. Mechanisms of ischemia-induced changes in brain water diffusion coefficient studied by brain MRI and brain microdialysis. Stroke 1992;23:746-754
    1. Baker LL, Kucharcyzk J, Sevick RJ, Mintorovich J, Moseley M. Recent advances in MR imaging/spectroscopy of cerebral ischemia. AJR Am J Roentgenol 1991; 156:1133-1143 - PubMed
    1. Sevick RJ, Kanda F, Mintorovich J, et al. Cytotoxic brain edema: assessment with diffusion-weighted MR imaging. Radiology 1992;185:687-690 - PubMed
    1. Mintorovich J, Baker LL, Yang GY, et al. Diffusion weighted hyperintensity in early cerebral ischemia: correlation with brain water content and ATPase activity. Proc Soc Magn Reson 1991;10:329

LinkOut - more resources