

Rapid alterations in diffusion-weighted images with anatomic correlates in a rodent model of status epilepticus
- PMID: 11110536
- PMCID: PMC7974296
Rapid alterations in diffusion-weighted images with anatomic correlates in a rodent model of status epilepticus
Abstract
Background and purpose: Diffusion-weighted MR imaging has emerged as a noninvasive tool for the detection of regional neuronal damage. We hypothesize that changes in diffusion-weighted images will correlate with pathophysiologic alterations caused by pilocarpine-induced status epilepticus.
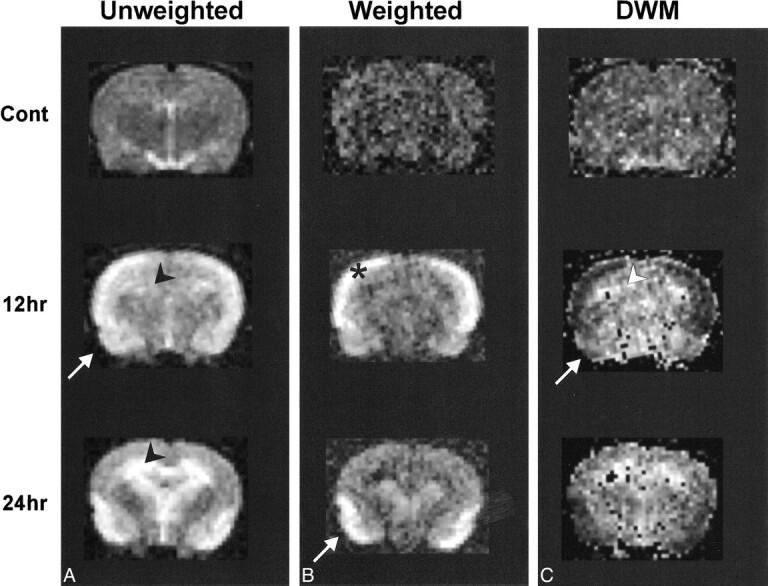
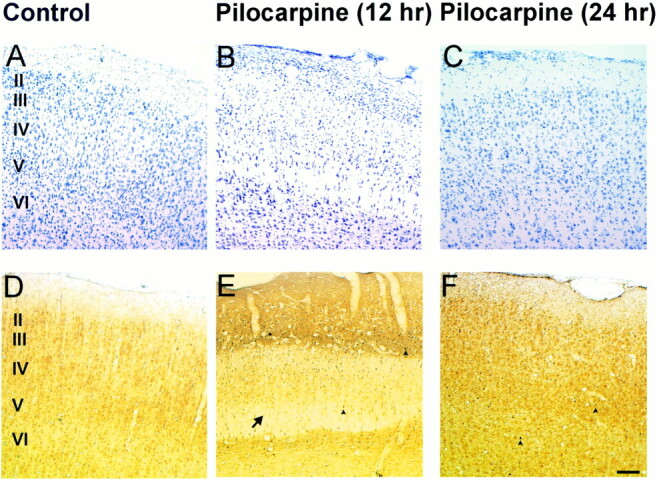
Methods: MR images of brain tissues were examined in vivo by use of T2- and diffusion-weighted imaging at 3, 6, 12, and 24 hours after pilocarpine-induced seizures. Histologic verification of neuronal damage was also performed after imaging to assess the extent and the time course of neuronal cell death.
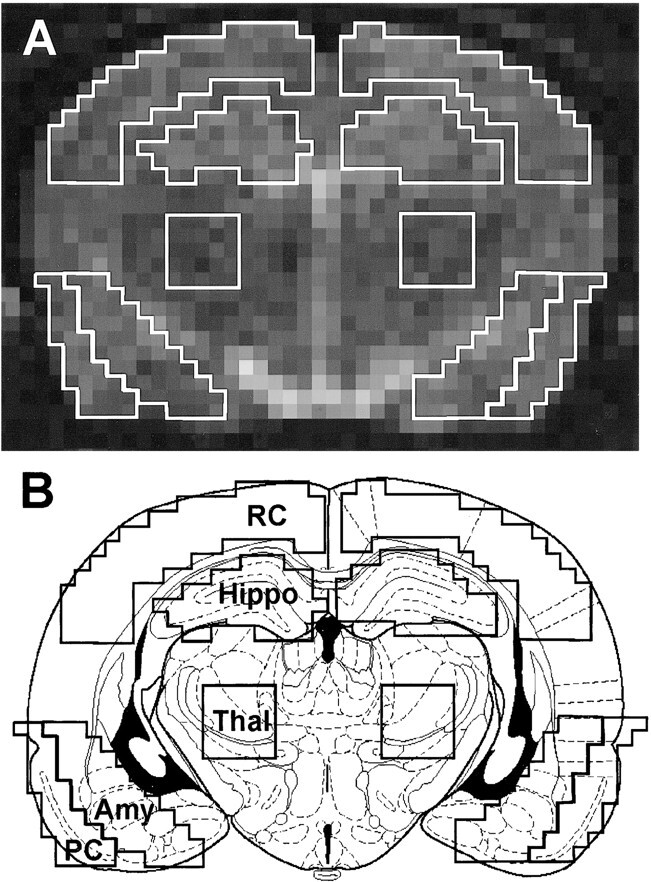
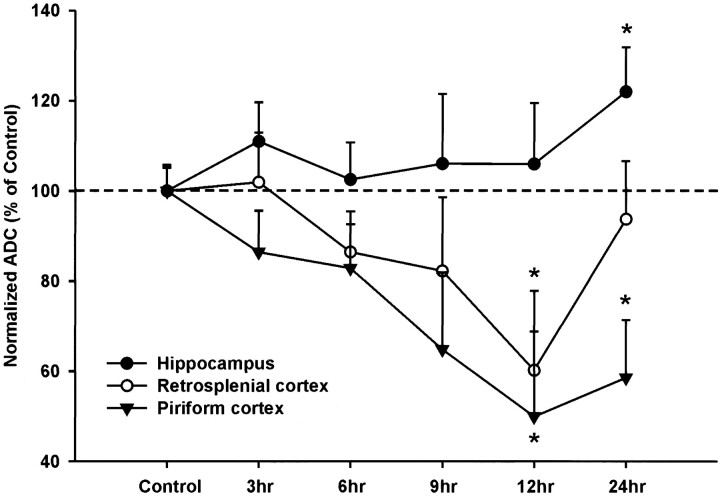
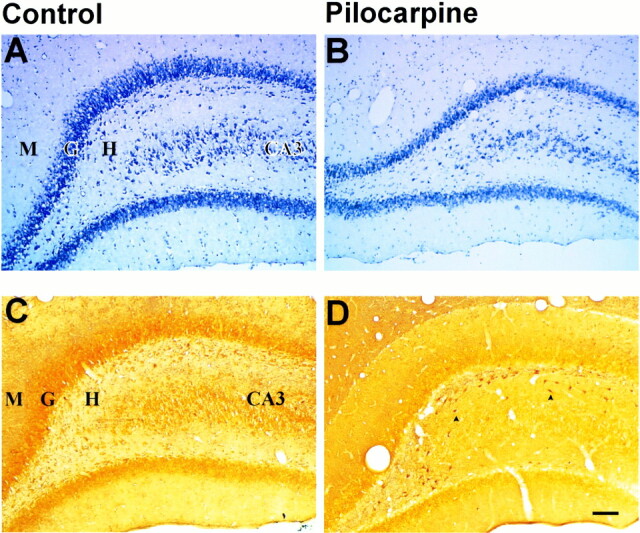
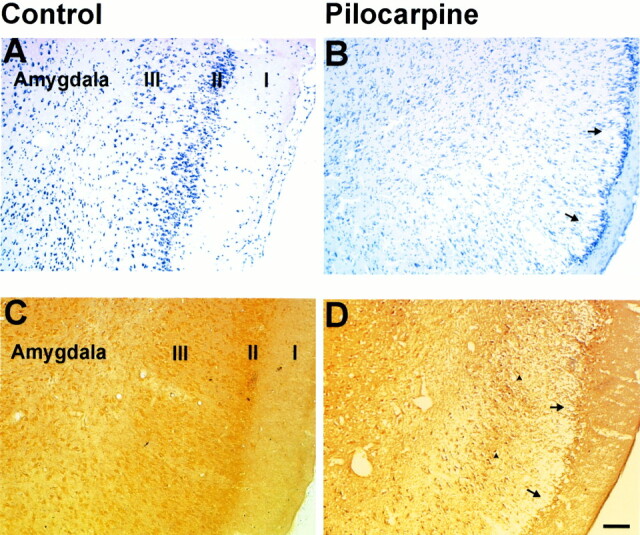
Results: The piriform cortex, amygdala, and retrosplenial (and somatosensory) cortex displayed significant apparent diffusion coefficient (ADC) decreases 12 hours after seizure initiation. In contrast, an ADC rise of 19% was observed in the hippocampus 24 hours after seizure induction. Histologic data from the piriform cortex and amygdala confirmed severe neuronal loss, whereas hippocampal damage was much less pronounced at 12 hours. Interestingly, very little histologic damage was seen in the retrosplenial cortex.
Conclusion: This study capitalized on diffusion-weighted imaging as a sensitive technique for the early identification of seizure-induced neuronal damage and differentiation of regional severity of these alterations. Hippocampal neuropathology is slower and longer in duration (approximately 7 days), while the piriform cortex and amygdala exhibit very rapid neurodegenerative alterations (approximately 24 hours) after pilocarpine-induced status epilepticus. These histologic changes are reflected in opposing ADC values within these regions.
Figures
Comment in
-
The status of status: seizures are bad for your brain's health.AJNR Am J Neuroradiol. 2000 Nov-Dec;21(10):1782-3. AJNR Am J Neuroradiol. 2000. PMID: 11110527 Free PMC article. No abstract available.
Similar articles
-
Neuronal and glial cell populations in the piriform cortex distinguished by using an approximation of q-space imaging after status epilepticus.AJNR Am J Neuroradiol. 2004 Aug;25(7):1225-33. AJNR Am J Neuroradiol. 2004. PMID: 15313715 Free PMC article.
-
Monitoring of acute generalized status epilepticus using multilocal diffusion MR imaging: early prediction of regional neuronal damage.AJNR Am J Neuroradiol. 2007 Feb;28(2):321-7. AJNR Am J Neuroradiol. 2007. PMID: 17297006 Free PMC article.
-
Magnetic resonance imaging of changes elicited by status epilepticus in the rat brain: diffusion-weighted and T2-weighted images, regional blood volume maps, and direct correlation with tissue and cell damage.Neuroimage. 2003 Feb;18(2):375-89. doi: 10.1016/s1053-8119(02)00025-3. Neuroimage. 2003. PMID: 12595191
-
Early diffusion-weighted MRI predicts regional neuronal damage in generalized status epilepticus in rats treated with diazepam.Neurosci Lett. 2007 May 7;417(3):275-80. doi: 10.1016/j.neulet.2007.02.072. Epub 2007 Mar 2. Neurosci Lett. 2007. PMID: 17367928
-
Diffusion-weighted MR of the brain: methodology and clinical application.Radiol Med. 2005 Mar;109(3):155-97. Radiol Med. 2005. PMID: 15775887 Review. English, Italian.
Cited by
-
The Anticonvulsant Effect of Hydroethanolic Leaf Extract of Calotropis procera (Ait) R. Br. (Apocynaceae).Neural Plast. 2021 Jun 26;2021:5566890. doi: 10.1155/2021/5566890. eCollection 2021. Neural Plast. 2021. PMID: 34257639 Free PMC article.
-
Neuronal and glial cell populations in the piriform cortex distinguished by using an approximation of q-space imaging after status epilepticus.AJNR Am J Neuroradiol. 2004 Aug;25(7):1225-33. AJNR Am J Neuroradiol. 2004. PMID: 15313715 Free PMC article.
-
Evolution of beta-amyloid induced neuropathology: magnetic resonance imaging and anatomical comparisons in the rodent hippocampus.MAGMA. 2002 Jun;14(3):223-32. doi: 10.1007/BF02668216. MAGMA. 2002. PMID: 12098565
-
Cerebral perfusion alterations during the acute phase of experimental generalized status epilepticus: prediction of survival by using perfusion-weighted MR imaging and histopathology.AJNR Am J Neuroradiol. 2005 Jun-Jul;26(6):1563-70. AJNR Am J Neuroradiol. 2005. PMID: 15956530 Free PMC article.
-
Comparison of multimodal findings on epileptogenic side in temporal lobe epilepsy using self-organizing maps.MAGMA. 2022 Apr;35(2):249-266. doi: 10.1007/s10334-021-00948-7. Epub 2021 Aug 4. MAGMA. 2022. PMID: 34347200
References
-
- Stears JC, Spitz MC. The imaging of epilepsy. Semin Ultrasound CT MRI 1996;17:221-250 - PubMed
-
- Margerison JH, Corsellis JAN. Epilepsy and the temporal lobes. A clinical, electroencephalographic and neuropathological study of the brain in epilepsy, with particular reference to the temporal lobes. Brain 1966;89:499-530 - PubMed
-
- Mathern GW, Babb TL, Mischel PS, et al. Childhood generalized and mesial temporal epilepsies demonstrate different amounts and patterns of hippocampal neuron loss and mossy fibre synaptic reorganization. Brain 1993;119:965-987 - PubMed
-
- Jack CR, Twomey CK, Zinsmeister AR, Sharbrough FW, Petersen RC, Cascino GD. Anterior temproal lobes and hippocampal formations: normative volumetric measurements from MR images in young adults. Radiology 1989;172:549-554 - PubMed
-
- Jack CR, Sharbrough FW, Twomey CK, et al. Temporal lobe seizures: lateralization with MR volume measurements of the hippocampal formation. Radiology 1990;175:423-429 - PubMed
Publication types
MeSH terms
Substances
LinkOut - more resources
Full Text Sources
Medical