. 2001 Jan;21(1):298-309.
doi: 10.1128/MCB.21.1.298-309.2001.

Position effects are influenced by the orientation of a transgene with respect to flanking chromatin

Affiliations

Position effects are influenced by the orientation of a transgene with respect to flanking chromatin

Y Q Feng et al. Mol Cell Biol. 2001 Jan.

Abstract

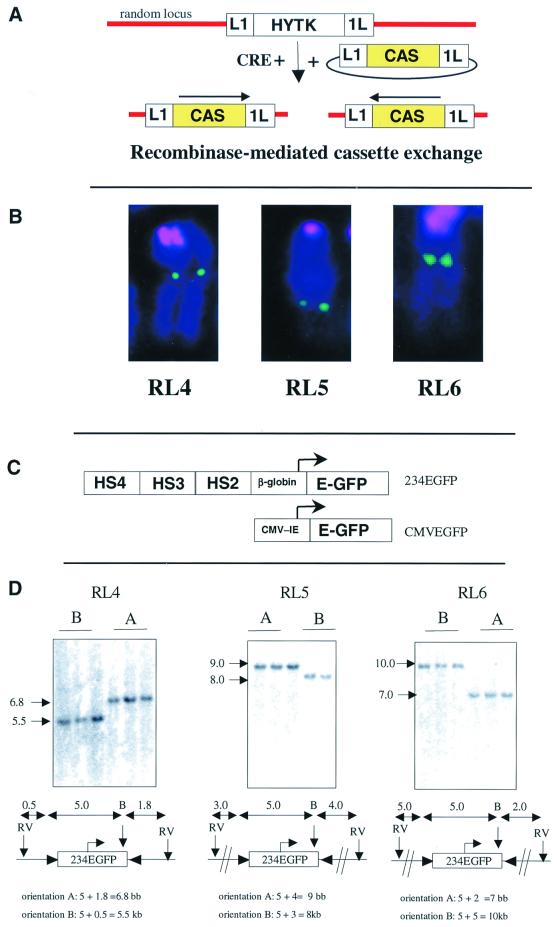
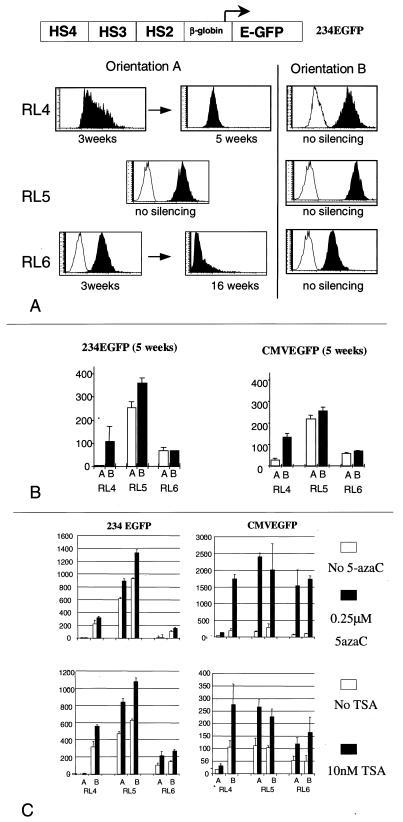
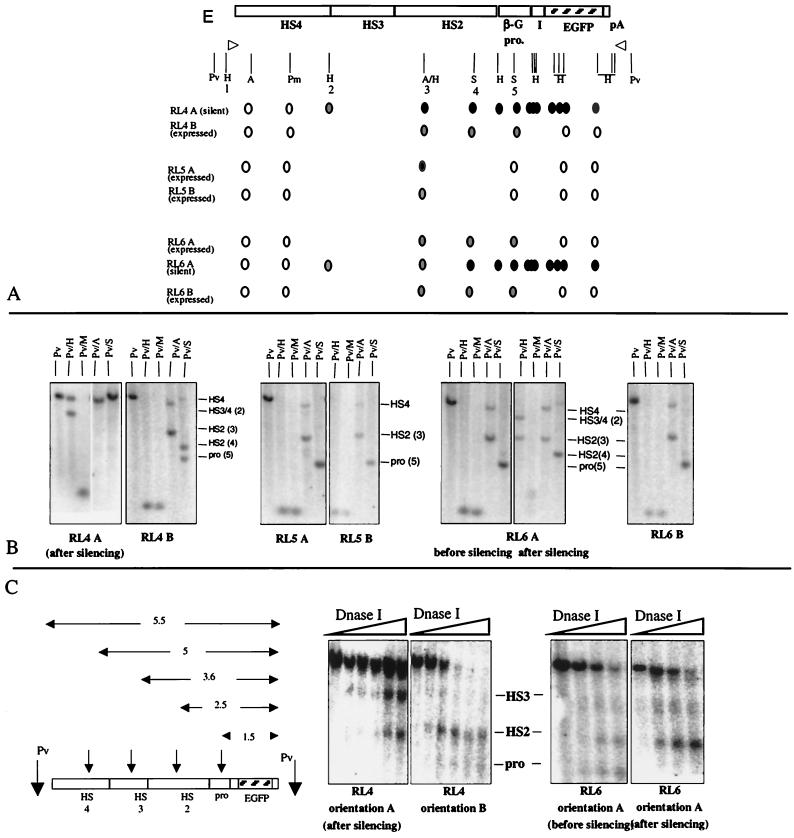
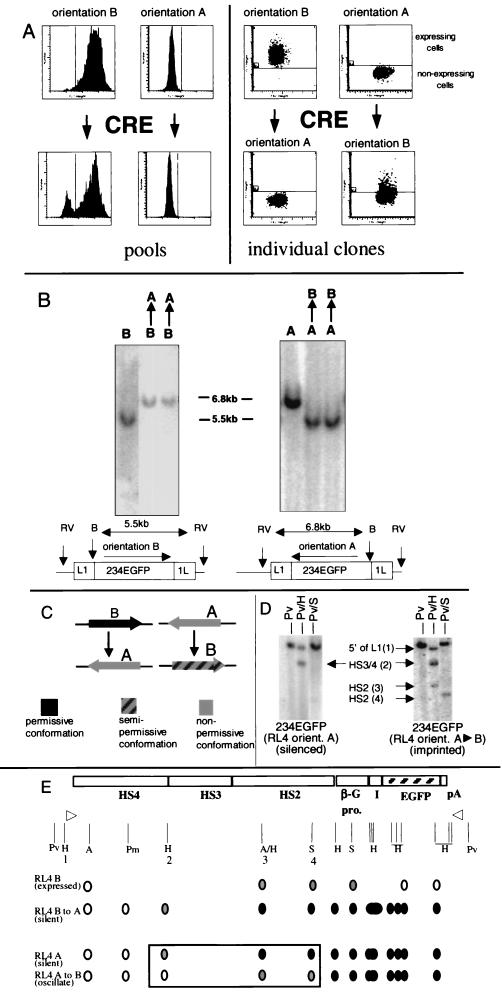
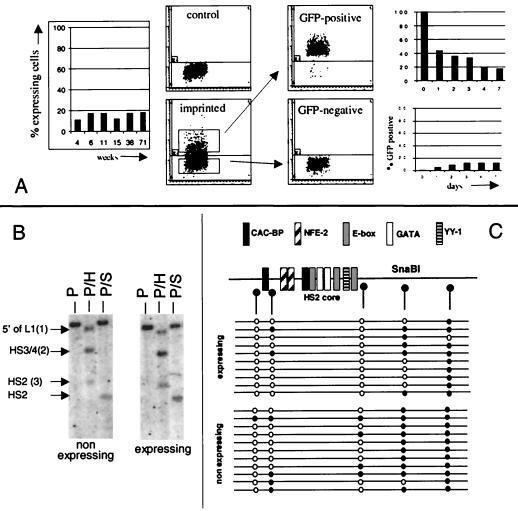
We have inserted two expression cassettes at tagged reference chromosomal sites by using recombinase-mediated cassette exchange in mammalian cells. The three sites of integration displayed either stable or silencing position effects that were dominant over the different enhancers present in the cassettes. These position effects were strongly dependent on the orientation of the construct within the locus, with one orientation being permissive for expression and the other being nonpermissive. Orientation-specific silencing, which was observed at two of the three site tested, was associated with hypermethylation but not with changes in chromatin structure, as judged by DNase I hypersensitivity assays. Using CRE recombinase, we were able to switch in vivo the orientation of the transgenes from the permissive to the nonpermissive orientation and vice versa. Switching from the permissive to the nonpermissive orientation led to silencing, but switching from the nonpermissive to the permissive orientation did not lead to reactivation of the transgene. Instead, transgene expression occurred dynamically by transcriptional oscillations, with 10 to 20% of the cells expressing at any given time. This result suggested that the cassette had been imprinted (epigenetically tagged) while it was in the nonpermissive orientation. Methylation analysis revealed that the methylation state of the inverted cassettes resembled that of silenced cassettes except that the enhancer had selectively lost some of its methylation. Sorting of the expressing and nonexpressing cell populations provided evidence that the transcriptional oscillations of the epigenetically tagged cassette are associated with changes in the methylation status of regulatory elements in the transgene. This suggests that transgene methylation is more dynamic than was previously assumed.


Figures

FIG. 1
FIG. 1
Site-specific integration at RL4, RL5, and RL6. (A) RMCE. Reference loci are created by insertion of plasmid L1HYTK1L at random integration sites in MEL cells. Expression cassettes are then integrated using RMCE by cotransfection of a Cre expression plasmid and a plasmid containing the expression cassette of interest. Cells that undergo an exchange can be selected for resistance to ganciclovir. Site-specific integration occurs in both possible orientations. (B) Three reference loci (random loci RL4, RL5, and RL6) were created and localized on the chromosomes by FISH. The chromosomes were stained with DAPI (blue pseudocolor), and the centromere were visualized with a CY3.5-labeled probe (red pseudocolor), and the reference loci were visualized indirectly with FITC-labeled avidin (green pseudocolor). None of the loci is near the centromere or telomere. (C) Cassette 234EGFP contains the coding sequence of the EGFP genes linked to a human β-globin promoter fragment and to HS2, HS3, and HS4 of the human β-globin LCR. Cassette CMVEGFP contains the same reporter linked to the CMV IE promoter-enhancer. (D) Southern blots demonstrating site-specific integration of cassette 234EGFP at RL4, RL5, and RL6 in both orientations. Three subclones with integration in each orientation at all three loci are shown (except RL5 orientation B, for which only two subclones are shown). Orientation was determined using chromosomal EcoRV sites for reference (see Materials and Methods).
FIG. 2
FIG. 2
Expression at RL4, RL5, and RL6. (A) Representative histograms obtained by flow cytometry of cells containing cassettes 234EGFP at RL4, RL5, and RL6 at various times postintegration. The white histogram overlays were obtained from control untransfected cells. The x axis shows the number of cells; the y axis shows the mean green fluorescence on a relative scale. Orientation-dependent stable and silencing position effects can be observed (see the text). (B) Bar graphs summarizing the expression levels (defined as the mean level of green fluorescence in 10,000 cells) of cassettes 234EGFP and CMVEGFP 5 to 6 weeks after integration at loci RL4, RL5, and RL6. The white bars show expression in orientation A, and the black bars show expression in orientation B. Each bar represents the average of two independent determinations of the expression level of three clones, and error bars indicate standard deviation. Silencing was not a factor in comparing expression levels between the various cell lines, since at 5 weeks postintegration the expression in all the samples tested was pancellular or absent (silencing at RL4 in orientation A was already complete but was minimal at RL6 in orientation A). (C) Cells with 234EGFP or CMVEGFP at RL4, RL5, and RL6 were incubated with 0.25 μM 5-azaC for 24 h (top panels) or with TSA for 48 h (bottom panels). Each bar represents the average (and standard deviation) of two independent experiments in which the expression level of three subclones containing one of the cassettes in each orientation was determined. The locus of integration and the orientation of the cassette are indicated below the bars.
FIG. 3
FIG. 3
Methylation and DNase I studies. (A) The first line represents the functional map of the cassette (the hatched bar in the EGFP coding sequence is the probe used for hybridization). The vertical lines are restriction sites (A, AvaI; H, HpaII; Pm, PmlI; Pv, PvuII; S, SnaBI). The open circles represent unmethylated CpGs (sites at which digestion was between 95 and 100% complete), the solid circles represent methylated CpGs (sites at which digestion was between 0 and 5% complete), and the shaded circles represent partially methylated CpG (sites at which digestion was between 5 and 95% complete). Expressed cassettes were largely unmethylated, while silenced cassettes were almost fully methylated at all the testable CpG in HS2, the promoter, and the EGFP coding sequence but unmethylated at HS4. The HpaII sites are numbered for reference in the text and in Fig. 3, 4, and 5. (B) Representative Southern blots. Genomic DNA was double digested with PvuII plus one of the methylation-sensitive enzymes and probed with the coding sequence of EGFP (Pv, PvuII, H, HpaII; M, MspI; S, SnaBI; A, AvaI). Number in parentheses refers to the restriction sites numbered in panel A. (C) DNase I HS mapping. Nuclei were digested for increasing times with DNase I, and genomic DNA was digested with PvuII (Pv) and probed with the EGFP coding sequence (hatched bar). The HSs are formed at least as well in the silenced constructs as in the active constructs. In contrast, an HS that maps at the promoter can be detected only in actively expressing cells.
FIG. 4
FIG. 4
In vivo inversion of the cassette does not fully reactivate the silenced cassette. (A) In vivo inversion of cassette 234EGFP at RL4 by transient transfection of a Cre expression plasmid. The four histograms on the left show flow cytometry analyses of pools of cells before and 4 weeks after transient transfection with a Cre expression plasmid. The appearance of the GFP-negative cell subpopulation after transient Cre expression in cells containing 234EGFP in orientation B (the permissive orientation) suggests that B-to-A inversions lead to silencing of the cassette. The absence of a GFP-positive cell subpopulation after transient CRE expression in cells with a cassette in orientation A suggests that A-to-B inversions do not fully reactivate the cassette. The four dot plots on the right show flow cytometry analyses of individual clones of cells having undergone B-to-A or A-to-B inversions as determined by Southern blot analyses (see Fig. 5B). Analysis of individual clones with a B-to-A inversion confirms that active cassettes are silenced by inversion. Analysis of individual clones with an A-to-B inversion reveals that silenced cassettes are not fully reactivated by inversion; instead, a low level of heterocellular expression is observed. (B) Southern blots demonstrating the A-to-B and B-to-A inversions. (C) Summary of the in vivo inversion experiments. Inversion from the permissive orientation (orientation B) to the nonpermissive orientation (orientation A) leads to transcriptional silencing. Inversion from the nonpermissive orientation to the permissive orientation leads to a heterocellular pattern expression instead of complete reactivation, indicating that the cassette was epigenetically tagged while it was silenced. (D) Southern blots illustrating the methylation analysis of the RL4 cassettes. After in vivo inversion, the cassette remains mostly methylated (compare with Fig. 3B, RL4 orientation B results). However, HS2 is subject to specific demethylation compared with the RL4 orientation A transgene. (E) Summary of methylation analysis after in vivo inversion of cassette 234EGFP at RL4. The vertical lines are restriction sites (H, HpaII-MspI; A, AvaI; P, PmlI; S, SnaBI). The open circles represent unmethylated CpGs, and the solid circles represent methylated CpGs; the shaded areas represent partially methylated CpGs. Epigenetic tagging of the A-to-B inverted cassette is associated with retention of methylation of the promoter and the EGFP coding sequence and with selective partial demethylation of the HS2 region.
FIG. 5
FIG. 5
Transcriptional oscillation of the 234EGFP cassette imprinted by inversion is associated with selective methylation changes at HS2. (A) In the left panel, cells with the imprinted cassette at RL4 were grown in culture for 71 weeks and the percentage of GFP-positive cells was tested periodically. The epigenetic tag was stable over this period since the GFP-positive fraction of cells remains between 10 and 20%. In the four middle panels, GFP-positive and GFP-negative cells were purified by flow cytometry (x axis, forward side scatter; y axis, green fluorescence). In the two right panels, bar graphs are shown summarizing the percent GFP-positive cells as a function of time when the GFP-positive and GFP-negative cell fractions were returned to culture and monitored daily for GFP expression. Both populations rapidly returned to the parental phenotype, demonstrating that expression in these cells occurs by transcriptional oscillations. (B) Methylation analyses of the two sorted fractions with methylation-sensitive restriction nucleases: H, HpaII; S, SnaBI; Pv, PvuII. Both the SnaBI site in HS2 and the HpaII site 3 (see Fig. 3) are methylated twice as much in the GFP-negative cells as in the GFP-positive cells. HpaII sites 2 and 3 (see Fig. 3) are comethylated in 45% of the GFP-negative cells but in only 30% of the GFP-positive cells. (C) Summary of bisulfite sequencing analysis of the plus strand of the core of HS2. Each line represents the methylation status of the five CpG dinucleotides of an allele (a single molecule) of HS2. The open circles represent unmethylated CpGs, and the solid circles represent methylated CpGs. The GFP-negative cells are generally less methylated than the GFP-positive cells. The three CpGs near the core of HS2 are less methylated than the two CpGs on the 3′ side. Each CpG dinucleotide therefore appears to have a specific probability of methylation.

Similar articles

Cited by

References

    1. Abremski K, Frommer B, Hoess R H. Linking-number changes in the DNA substrate during Cre-mediated loxP site-specific recombination. J Mol Biol. 1986;192:17–26. - PubMed
    1. Alami R, Greally J M, Tanimoto K, Hwang S, Feng Y Q, Engel J D, Fiering S, Bouhassira E E. Beta-globin YAC transgenes exhibit uniform expression levels but position effect variegation in mice. Hum Mol Genet. 2000;9:631–636. - PubMed
    1. Bergman Y, Mostoslavsky R. DNA demethylation: turning genes on. Biol Chem. 1998;379:401–407. - PubMed
    1. Bestor T H. Gene silencing as a threat to the success of gene therapy. J Clin Investig. 2000;105:409–411. - PMC - PubMed
    1. Bouhassira E E, Westerman K, Leboulch P. Transcriptional behavior of LCR enhancer elements integrated at the same chromosomal locus by recombinase-mediated cassette exchange. Blood. 1997;90:3332–3344. - PubMed

Publication types

MeSH terms

LinkOut - more resources