

Carbon flux distribution and kinetics of cellulose fermentation in steady-state continuous cultures of Clostridium cellulolyticum on a chemically defined medium
- PMID: 11114908
- PMCID: PMC94857
- DOI: 10.1128/JB.183.1.119-130.2001
Carbon flux distribution and kinetics of cellulose fermentation in steady-state continuous cultures of Clostridium cellulolyticum on a chemically defined medium
Abstract
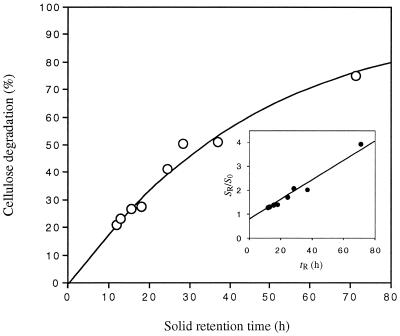
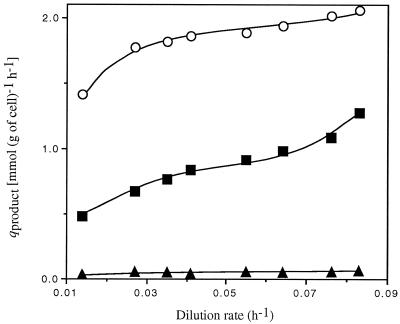
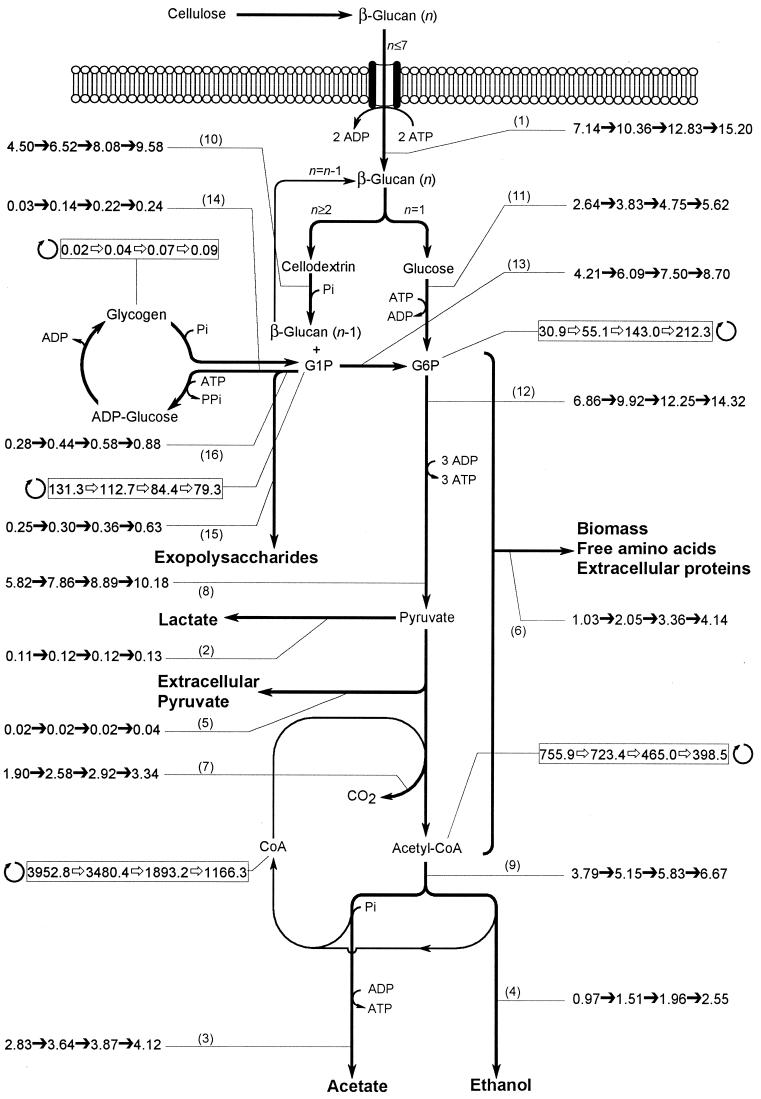
The metabolic characteristics of Clostridium cellulolyticum, a mesophilic cellulolytic nonruminal bacterium, were investigated and characterized kinetically for the fermentation of cellulose by using chemostat culture analysis. Since with C. cellulolyticum (i) the ATP/ADP ratio is lower than 1, (ii) the production of lactate at low specific growth rate (mu) is low, and (iii) there is a decrease of the NADH/NAD(+) ratio and q(NADH produced)/ q(NADH used) ratio as the dilution rate (D) increases in carbon-limited conditions, the chemostats used were cellulose-limited continuously fed cultures. Under all conditions, ethanol and acetate were the main end products of catabolism. There was no shift from an acetate-ethanol fermentation to a lactate-ethanol fermentation as previously observed on cellobiose as mu increased (E. Guedon, S. Payot, M. Desvaux, and H. Petitdemange, J. Bacteriol. 181:3262-3269, 1999). The acetate/ethanol ratio was always higher than 1 but decreased with D. On cellulose, glucose 6-phosphate and glucose 1-phosphate are important branch points since the longer the soluble beta-glucan uptake is, the more glucose 1-phosphate will be generated. The proportion of carbon flowing toward phosphoglucomutase remained constant (around 59.0%), while the carbon surplus was dissipated through exopolysaccharide and glycogen synthesis. The percentage of carbon metabolized via pyruvate-ferredoxin oxidoreductase decreased with D. Acetyl coenzyme A was mainly directed toward the acetate formation pathway, which represented a minimum of 27.1% of the carbon substrate. Yet the proportion of carbon directed through biosynthesis (i.e., biomass, extracellular proteins, and free amino acids) and ethanol increased with D, reaching 27.3 and 16.8%, respectively, at 0.083 h(-1). Lactate and extracellular pyruvate remained low, representing up to 1.5 and 0.2%, respectively, of the original carbon uptake. The true growth yield obtained on cellulose was higher, [50.5 g of cells (mol of hexose eq)(-1)] than on cellobiose, a soluble cellodextrin [36.2 g of cells (mol of hexose eq)(-1)]. The rate of cellulose utilization depended on the solid retention time and was first order, with a rate constant of 0.05 h(-1). Compared to cellobiose, substrate hydrolysis by cellulosome when bacteria are grown on cellulose fibers introduces an extra means for regulation of the entering carbon flow. This led to a lower mu, and so metabolism was not as distorted as previously observed with a soluble substrate. From these results, C. cellulolyticum appeared well adapted and even restricted to a cellulolytic lifestyle.
Figures
References
-
- Ahn H J, Lynd L R. Cellulose degradation and ethanol production by thermophilic bacteria using mineral growth medium. Appl Biochem Biotechnol. 1996;57–58:599–604. - PubMed
-
- Andersch W, Bahl H, Gottschalk G. Level of enzymes involved in acetate, butyrate, acetone and butanol formation by Clostridium acetobutylicum. Eur J Appl Microbiol Biotechnol. 1983;18:327–332.
-
- Andersen K B, von Meyenburg K. Charges of nicotinamide adenine nucleotides and adenylate energy charge as regulatory parameters of the metabolism in Escherichia coli. J Biol Chem. 1977;252:4151–4156. - PubMed
-
- Bayer E A, Chanzy H, Lamed R, Shoham Y. Cellulose, cellulases and cellulosomes. Curr Opin Struct Biol. 1998;8:548–557. - PubMed
-
- Bayer E A, Lamed R. The cellulose paradox: pollutant par excellence and/or a reclaimable natural resource? Biodegradation. 1992;3:171–188. - PubMed
Publication types
MeSH terms
Substances
LinkOut - more resources
Full Text Sources
Other Literature Sources
Research Materials
