

Only fibres promoting a stable butyrate producing colonic ecosystem decrease the rate of aberrant crypt foci in rats
- PMID: 11115823
- PMCID: PMC1728184
- DOI: 10.1136/gut.48.1.53
Only fibres promoting a stable butyrate producing colonic ecosystem decrease the rate of aberrant crypt foci in rats
Abstract
Background: Dietary fibres have been proposed as protective agents against colon cancer but results of both epidemiological and experimental studies are inconclusive.
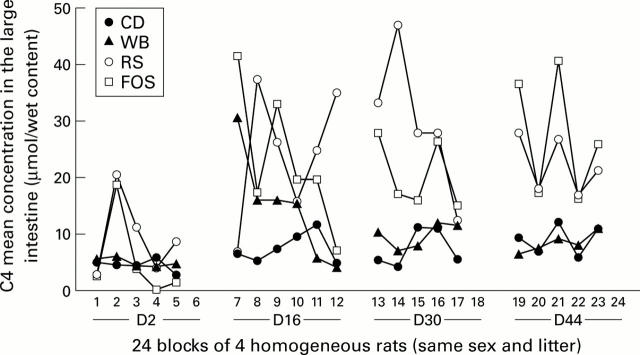
Aims: Hypothesising that protection against colon cancer may be restricted to butyrate producing fibres, we investigated the factors needed for long term stable butyrate production and its relation to susceptibility to colon cancer.
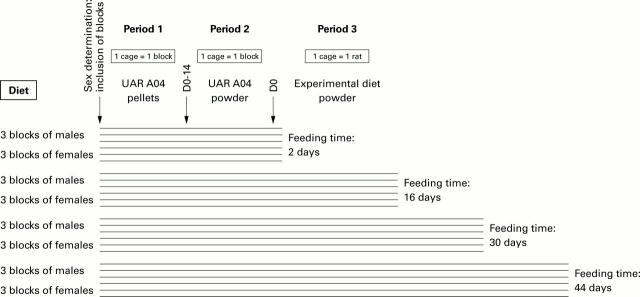
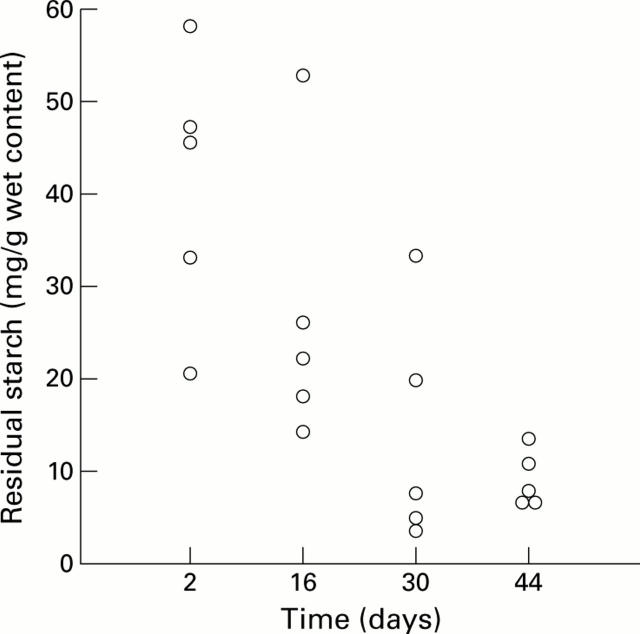
Methods: A two part randomised blinded study in rats, mimicking a prospective study in humans, was performed using a low fibre control diet (CD) and three high fibre diets: starch free wheat bran (WB), type III resistant starch (RS), and short chain fructo-oligosaccharides (FOS). Using a randomised block design, 96 inbred rats were fed for two, 16, 30, or 44 days to determine the period of adaptation to the diets, fermentation profiles, and effects on the colon, including mucosal proliferation on day 44. Subsequently, 36 rats fed the same diets for 44 days were injected with azoxymethane and checked for aberrant crypt foci 30 days later.
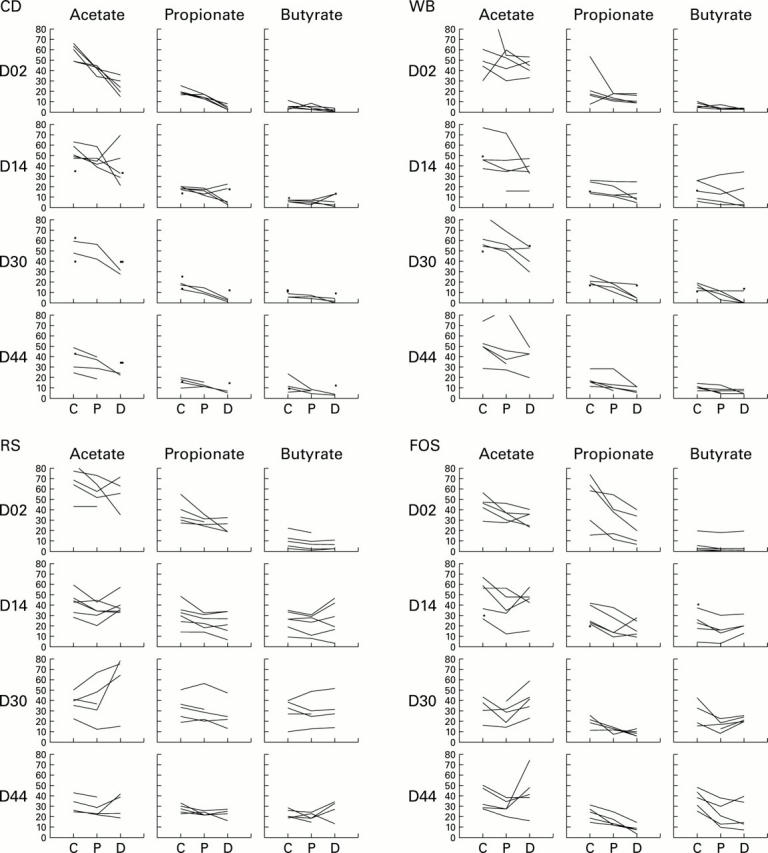
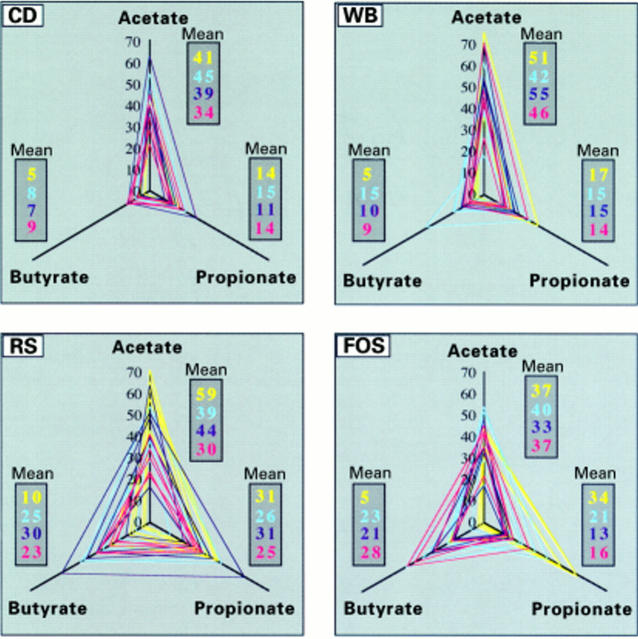
Results: After fermentation had stabilised (44 days), only RS and FOS produced large amounts of butyrate, with a trophic effect in the large intestine. No difference in mucosal proliferation between the diets was noted at this time. In the subsequent experiment one month later, fewer aberrant crypt foci were present in rats fed high butyrate producing diets (RS, p=0.022; FOS, p=0.043).
Conclusion: A stable butyrate producing colonic ecosystem related to selected fibres appears to be less conducive to colon carcinogenesis.
Figures
Similar articles
-
Fructooligosaccharide associated with celecoxib reduces the number of aberrant crypt foci in the colon of rats.Reprod Nutr Dev. 2003 Jul-Aug;43(4):347-56. doi: 10.1051/rnd:2003028. Reprod Nutr Dev. 2003. PMID: 14971826
-
Effects of high amylose maize starch and Clostridium butyricum on metabolism in colonic microbiota and formation of azoxymethane-induced aberrant crypt foci in the rat colon.Microbiol Immunol. 2003;47(12):951-8. doi: 10.1111/j.1348-0421.2003.tb03469.x. Microbiol Immunol. 2003. PMID: 14695445
-
Restoration of the integrity of rat caeco-colonic mucosa by resistant starch, but not by fructo-oligosaccharides, in dextran sulfate sodium-induced experimental colitis.Br J Nutr. 2003 Jul;90(1):75-85. doi: 10.1079/bjn2003867. Br J Nutr. 2003. PMID: 12844378
-
Dietary resistant starch and chronic inflammatory bowel diseases.Int J Colorectal Dis. 1999 Nov;14(4-5):201-11. doi: 10.1007/s003840050212. Int J Colorectal Dis. 1999. PMID: 10647628 Review.
-
Mechanisms of primary cancer prevention by butyrate and other products formed during gut flora-mediated fermentation of dietary fibre.Mutat Res. 2009 Jul-Aug;682(1):39-53. doi: 10.1016/j.mrrev.2009.04.001. Epub 2009 Apr 19. Mutat Res. 2009. PMID: 19383551 Review.
Cited by
-
Interplay between diet, gut microbiota, epigenetic events, and colorectal cancer.Mol Nutr Food Res. 2017 Jan;61(1):10.1002/mnfr.201500902. doi: 10.1002/mnfr.201500902. Epub 2016 Jun 2. Mol Nutr Food Res. 2017. PMID: 27138454 Free PMC article. Review.
-
Sodium Butyrate Inhibits the Expression of Thymidylate Synthase and Induces Cell Death in Colorectal Cancer Cells.Int J Mol Sci. 2024 Jan 26;25(3):1572. doi: 10.3390/ijms25031572. Int J Mol Sci. 2024. PMID: 38338851 Free PMC article.
-
Moderate Exercise Has Limited but Distinguishable Effects on the Mouse Microbiome.mSystems. 2017 Aug 22;2(4):e00006-17. doi: 10.1128/mSystems.00006-17. eCollection 2017 Jul-Aug. mSystems. 2017. PMID: 28845459 Free PMC article.
-
Coffee Pulp, a By-Product of Coffee Production, Modulates Gut Microbiota and Improves Metabolic Syndrome in High-Carbohydrate, High-Fat Diet-Fed Rats.Pathogens. 2021 Oct 22;10(11):1369. doi: 10.3390/pathogens10111369. Pathogens. 2021. PMID: 34832525 Free PMC article.
-
Mechanistic Review on the Role of Gut Microbiota in the Pathology of Cardiovascular Diseases.Cardiovasc Hematol Disord Drug Targets. 2024;24(1):13-39. doi: 10.2174/011871529X310857240607103028. Cardiovasc Hematol Disord Drug Targets. 2024. PMID: 38879769 Review.
References
Publication types
MeSH terms
Substances
LinkOut - more resources
Full Text Sources
Other Literature Sources
Medical