

Review
doi: 10.1136/gut.48.1.125.
Visceral hypersensitivity: facts, speculations, and challenges
Affiliations
- PMID: 11115834
- PMCID: PMC1728183
- DOI: 10.1136/gut.48.1.125
Item in Clipboard
Review
Visceral hypersensitivity: facts, speculations, and challenges
Gut.
2001 Jan.
No abstract available
Figures
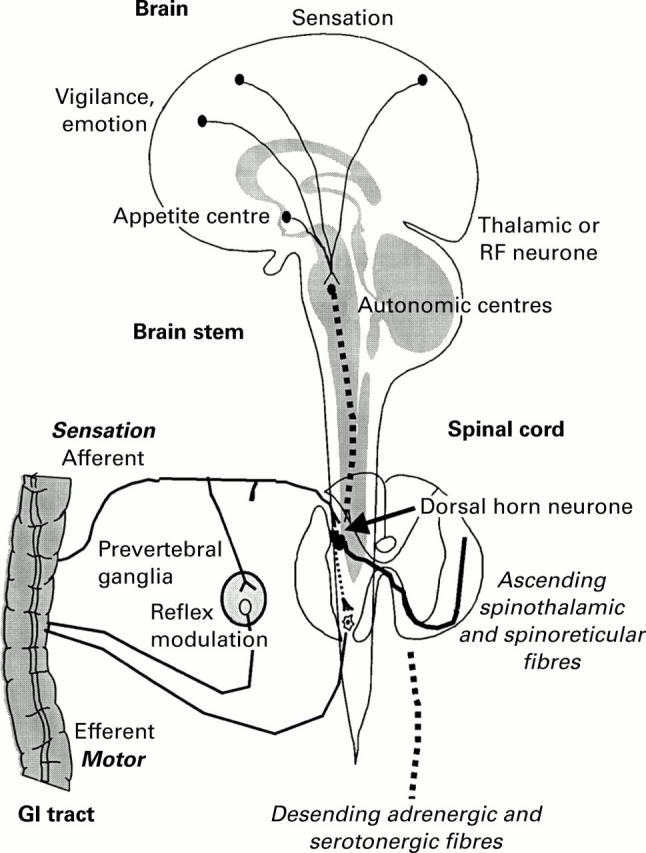
Three order neurone chain resulting in visceral perception; note the descending pathways converging on the dorsal horn neurone modulating the projections from this relay station to the surface and to the brain.
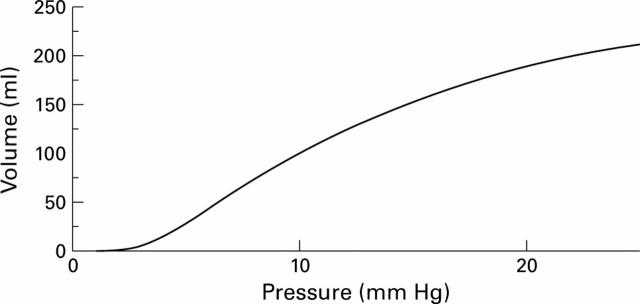
Example of a compliance curve (volume response to imposed pressure) in a segment of human colon. The curve is obtained by stepwise increments of intraballoon pressure and simultaneous measurement of intraballoon pressure. Note the initial "cushion" in which an increase in pressure does not result in any change in volume. The second portion of the compliance curve is more linear and partly reflects the elasticity of the viscus.
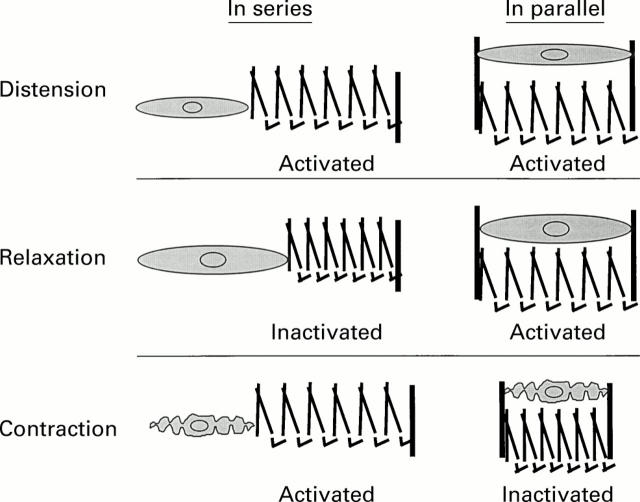
Schematic illustration of responses of tension mechanoreceptors (in series) and elongation mechanoreceptors (in parallel) to distension, relaxation, and contraction of gastric smooth muscle. Mechanoreceptors are modelled as coils and positioned in parallel (right) or in series (left) to the muscle. In series, receptors are activated during distension and contraction against a resistance; they become inactivated during relaxation. In parallel, receptors are activated during distension and relaxation, and become inactivated during contraction.
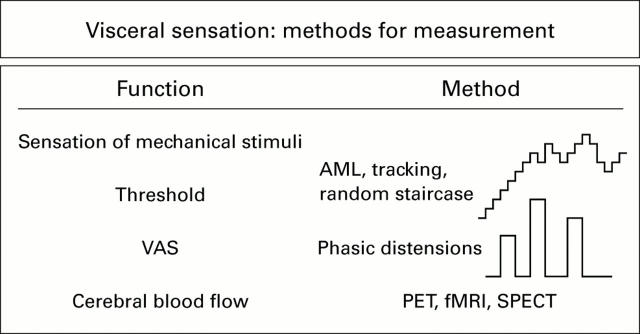
Schema demonstrating distension paradigms used in visceral sensation studies. PET, positron emission tomography; fMRI, functional magnetic resonance imaging; SPECT, single photon emission computed tomography; VAS, visual analogue scale; AML, ascending method of limits.
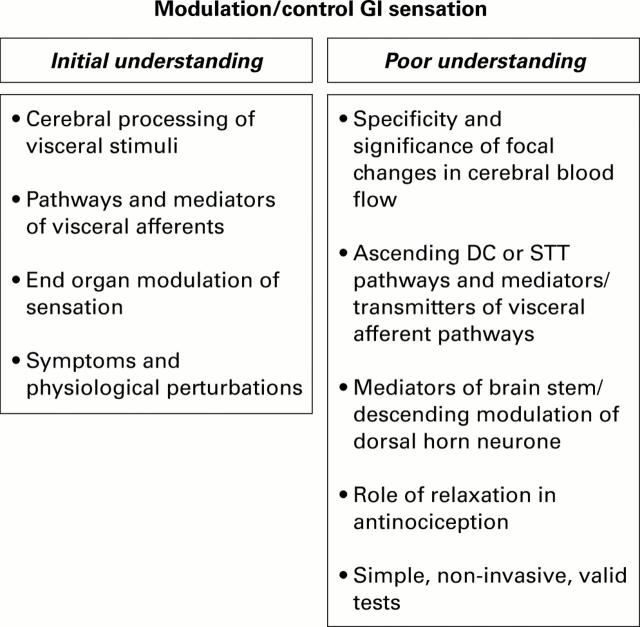
Gaps in current knowledge of visceral sensation. DC, dorsal column; STT, spinothalamic tract.
Publication types
MeSH terms
LinkOut - more resources
Full Text Sources
Other Literature Sources
Medical