. 2000 Dec;124(4):1570-81.
doi: 10.1104/pp.124.4.1570.

Microarray analysis of developing Arabidopsis seeds

Affiliations

Microarray analysis of developing Arabidopsis seeds

T Girke et al. Plant Physiol. 2000 Dec.

Abstract

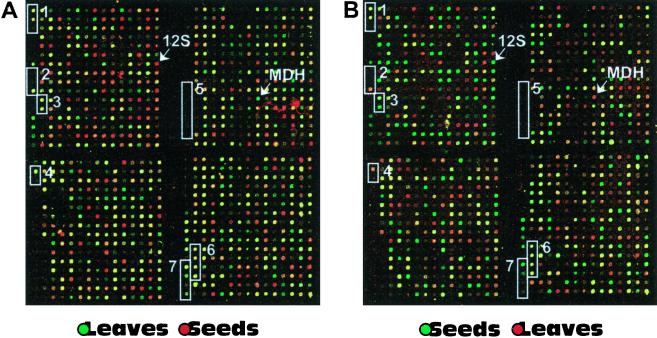
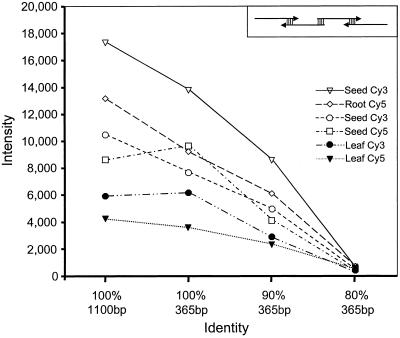
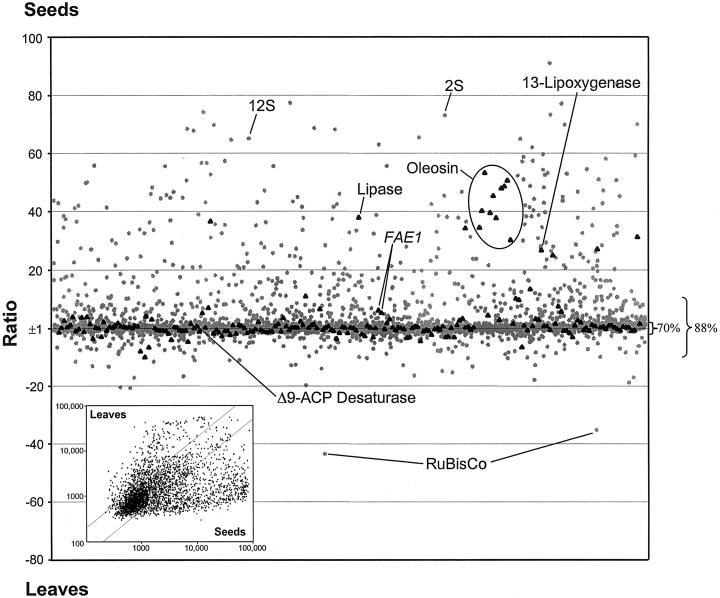
To provide a broad analysis of gene expression in developing Arabidopsis seeds, microarrays have been produced that display approximately 2,600 seed-expressed genes. DNA for genes spotted on the arrays were selected from >10,000 clones partially sequenced from a cDNA library of developing seeds. Based on a series of controls, sensitivity of the arrays was estimated at one to two copies of mRNA per cell and cross hybridization was estimated to occur if closely related genes have >70% to 80% sequence identity. These arrays have been hybridized in a series of experiments with probes derived from seeds, leaves, and roots of Arabidopsis. Analysis of expression ratios between the different tissues has allowed the tissue-specific expression patterns of many hundreds of genes to be described for the first time. Approximately 25% of the 2, 600 genes were expressed at ratios > or =2-fold higher in seeds than leaves or roots and 10% at ratios > or =10. Included in this list are a large number of proteins of unknown function, and potential regulatory factors such as protein kinases, phosphatases, and transcription factors. The Arabidopsis arrays were also found to be useful for transcriptional profiling of mRNA isolated from developing oilseed rape (Brassica napus) seeds and expression patterns correlated well between the two species.


Figures

Figure 1
Figure 1
Microarray segments from repeated experiments. The two images show the same segments from two microarray hybridizations in false color presentation. In both experiments the arrays were cohybridized with fluorescence probes from seeds and leaves. A represents an experiment in which the leaf sample was labeled with Cy3 and the seed sample with Cy5. B shows the replicate experiment in which the fluorescence labels were incorporated in opposite orientation (leaf with Cy5; seed with Cy3). 12S and MDH indicate elements that contain DNA fragments coding for 12S seed storage protein (clone M10C10S) and plastidial malate dehydrogenase (clone M44F11), respectively. The white boxes highlight control elements localized within the given image segment. In the following they are explained always from the top to the bottom of the boxes. Specificity (cross hybridization) controls, Box 1 shows specificity controls consisting of three 365-bp FAD2 fragments with identical GC content; original FAD2 sequence, two synthetic forms with 90% and 80% identity; box 2 contains three different sequences coding for ferredoxins; as shown in Figure 1 and as described in “Materials and Methods,” additional controls monitored for nonspecific hybriclization carry over during and for mRNA integrity/probe length, from soybean with 63% identity to corresponding Arabidopsis sequence, from Impatiens with 66% identity, and from Arabidopsis. Amount of rRNA in mRNA and probe samples, Box 3 contains sequences coding for 25S rRNA and 18S rRNA from Arabidopsis. Carry-over of DNA during printing process, Box 4 includes a highly expressed sequence for Rubisco SSU and a negative control containing only 3× SSC, which were arrayed in this order from the same printing pin. Unspecific cross hybridization, Box 5 contains six PCR products from unrelated human cDNA sequences with the IDs 136643, 204716, 60027, 756944, 29328, and IB187. RNA and cDNA probe quality control, Box 6 contains 365-bp fragments from the 5′-, central, and 3′-regions of the FAD2 sequence and its full-length form of about 1,100 bp. Sensitivity control, Box 7 shows four elements containing different human sequences (IDs 1593605, 1020153, 1592600, and 1576490) for which in vitro transcribed poly(A)+ RNA was spiked into the RNA samples in concentrations of 1:10,000, 1:25,000, 1:50,000, and 1:75,000.
Figure 2
Figure 2
Detection of cross hybridization. The fluorescence intensity values of four different FAD2 fragments are plotted for three cohybridization experiments with Cy3/Cy5 probes. The corresponding tissues and fluorescence dyes used for probe synthesis are given on the right. The four FAD2 fragments are displayed on the x axis in the following order: 1,100-bp form of FAD2, 365-bp fragment with 100% identity to the 3′-coding area of FAD2, and two synthetic fragments with 90% and 80% sequence identity, respectively, covering the same 3′-segment of FAD2 as the 100% fragment. All four sequences have identical GC content (48%). The two synthetic fragments contain evenly spaced mismatches and were synthesized by a PCR strategy with four overlapping 110-mer primers (displayed in box in upper right corner).
Figure 3
Figure 3
Scatter plot of the ratios of the normalized fluorescence intensity values from a seed versus leaf comparison. Expression values that are higher in seeds are plotted upwards and those that are higher in leaves are plotted downwards. Ratios from sequences involved in lipid metabolism and related pathways are displayed with black triangles. All other sequences are represented with gray dots. The percentage values on the right side represent the amount of signals localized within the ratio ranges of ±2 and ±10. Inset, Plot of leaf intensity values versus seed intensity values from same data set.

Similar articles

Cited by

References

    1. Abell BM, Holbrook LA, Abenes M, Murphy DJ, Hills MJ, Moloney MM. Role of the proline knot motif in oleosin endoplasmic reticulum topology and oil body targeting. Plant Cell. 1997;9:1481–1493. - PMC - PubMed
    1. DeRisi JL, Iyer VR, Brown PO. Exploring the metabolic and genetic control of gene expression on a genomic scale. Science. 1997;278:680–686. - PubMed
    1. De Rocher EJ, Vargo-Gogola TC, Diehn SH, Green PJ. Direct evidence for rapid degradation of Bacillus thuringiensis toxin mRNA as a cause of poor expression in plants. Plant Physiol. 1998;117:1445–1461. - PMC - PubMed
    1. Desprez T, Amselem J, Caboche M, Hofte H. Differential gene expression in Arabidopsis monitored using cDNA arrays. Plant J. 1998;14:643–652. - PubMed
    1. Dillon PJ, Rosen CA. A rapid method for the construction of synthetic genes using the polymerase chain reaction. Biotechniques. 1990;9:298–300. - PubMed

Publication types

MeSH terms

Substances

LinkOut - more resources