Comparative Study
. 2000 Dec;10(12):1903-14.
doi: 10.1101/gr.10.12.1903.

A comparative map of the zebrafish genome

Affiliations
Comparative Study

A comparative map of the zebrafish genome

I G Woods et al. Genome Res. 2000 Dec.

Abstract

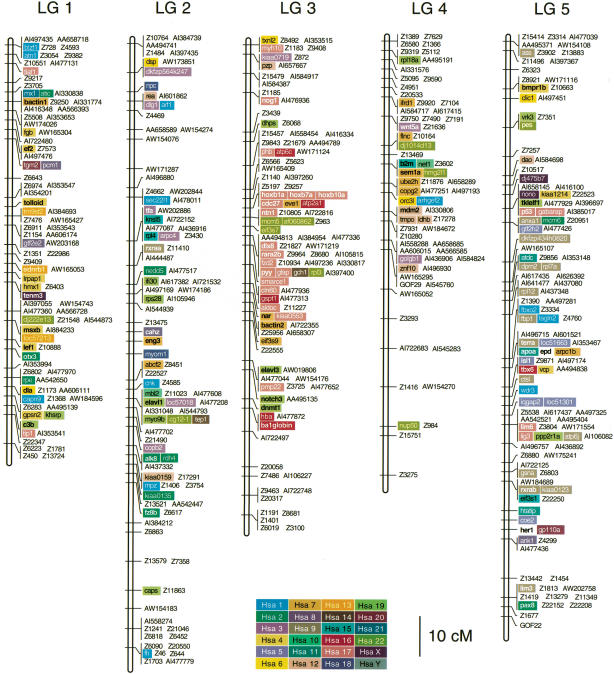
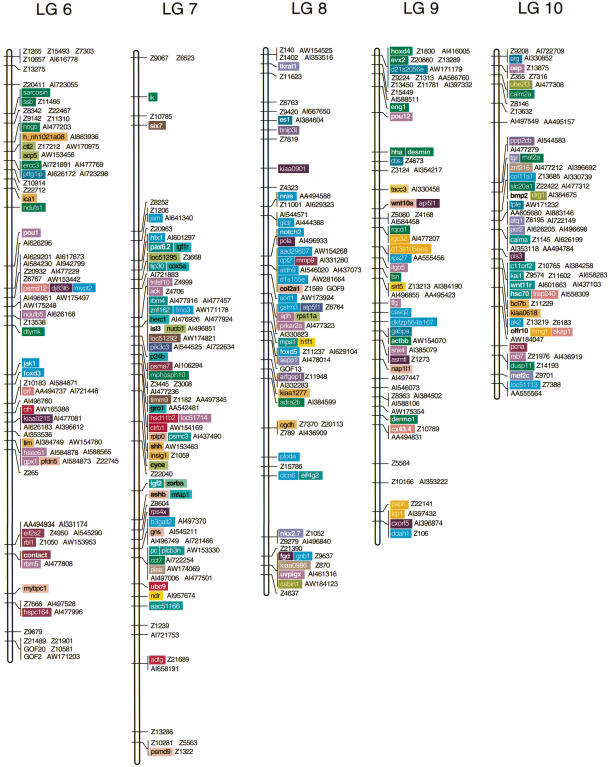
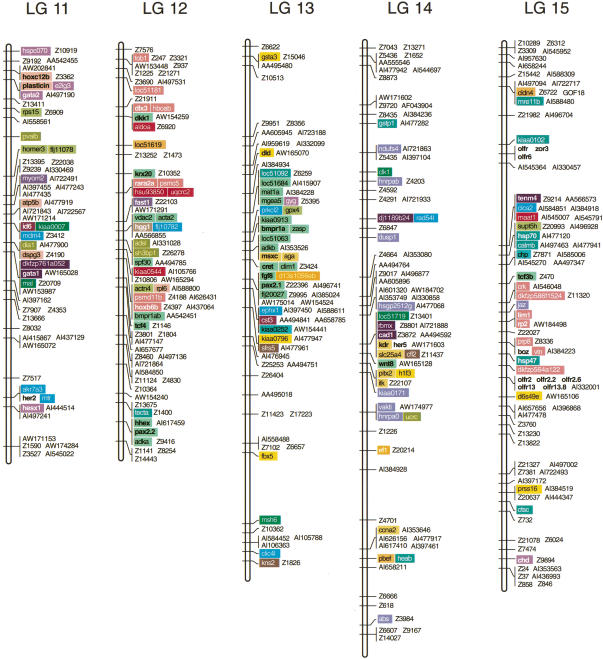
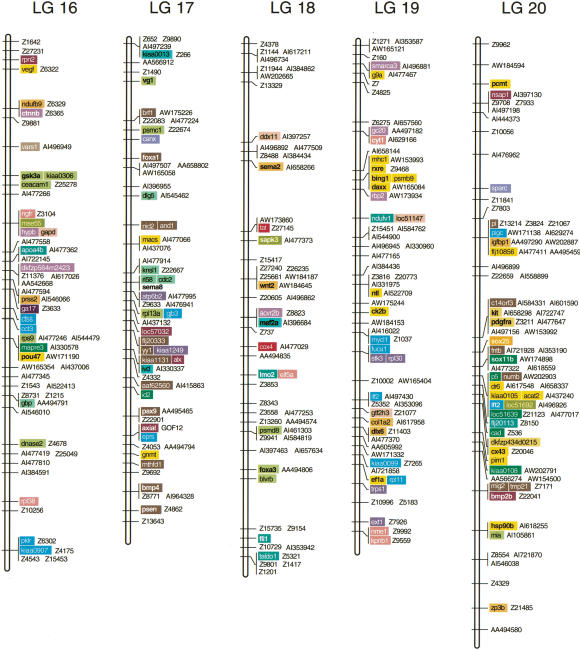
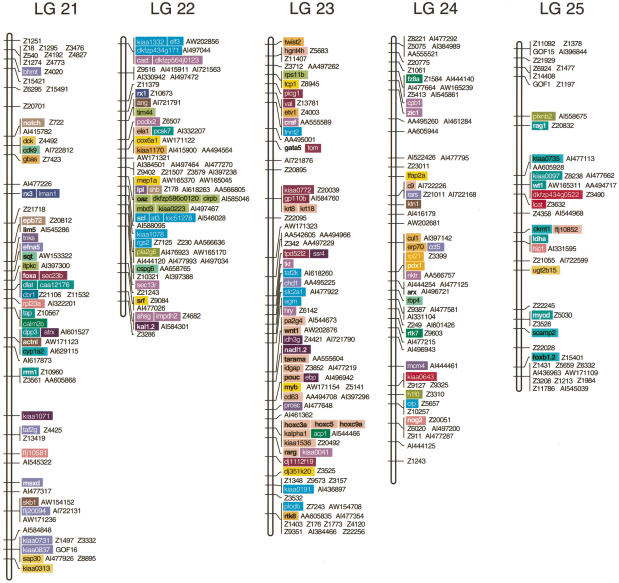
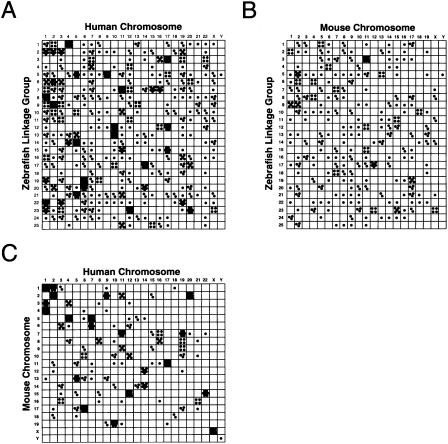
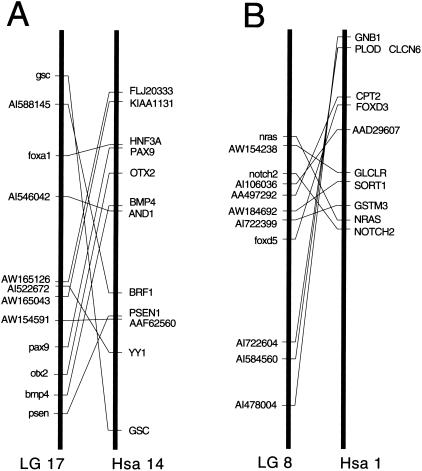
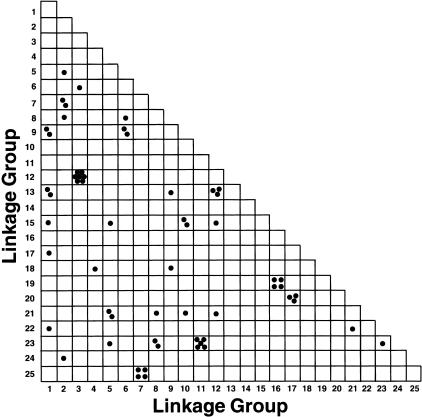
Zebrafish mutations define the functions of hundreds of essential genes in the vertebrate genome. To accelerate the molecular analysis of zebrafish mutations and to facilitate comparisons among the genomes of zebrafish and other vertebrates, we used a homozygous diploid meiotic mapping panel to localize polymorphisms in 691 previously unmapped genes and expressed sequence tags (ESTs). Together with earlier efforts, this work raises the total number of markers scored in the mapping panel to 2119, including 1503 genes and ESTs and 616 previously characterized simple-sequence length polymorphisms. Sequence analysis of zebrafish genes mapped in this study and in prior work identified putative human orthologs for 804 zebrafish genes and ESTs. Map comparisons revealed 139 new conserved syntenies, in which two or more genes are on the same chromosome in zebrafish and human. Although some conserved syntenies are quite large, there were changes in gene order within conserved groups, apparently reflecting the relatively frequent occurrence of inversions and other intrachromosomal rearrangements since the divergence of teleost and tetrapod ancestors. Comparative mapping also shows that there is not a one-to-one correspondence between zebrafish and human chromosomes. Mapping of duplicate gene pairs identified segments of 20 linkage groups that may have arisen during a genome duplication that occurred early in the evolution of teleosts after the divergence of teleost and mammalian ancestors. This comparative map will accelerate the molecular analysis of zebrafish mutations and enhance the understanding of the evolution of the vertebrate genome.


Figures

Figure 1
Figure 1
Genetic linkage map of the zebrafish genome. The positions of 2119 polymorphic markers mapped in the heat shock (HS) panel are shown. Genes and expressed sequence tags (ESTs) with identified human orthologs are color coded according the chromosomal position of the human gene. Gene names are shown in bold type. According to zebrafish convention (http://zfin.org/zf_info/nomen.html), ESTs with putative human orthologs are named according to their human counterparts. Other ESTs are named by their GenBank accession numbers. Simple-sequence length polymorphism names begin with “Z” or “GOF”, following the nomenclature of Shimoda et al. (1999). This map reports revised positions for three genes, tbx6, isl3, and six7, that were assigned to different locations in previous maps (Postlethwait et al. 1998; Geisler et al. 1999; Kelly et al. 2000). In addition, we have revised two previous assignments (Kelly et al. 2000) for ESTs, and we have removed from the dataset eight ESTs that were originally mapped in the HS panel because of discrepancies detected in repeat genotype assays. Sequence comparisons of the ESTs mapped in the HS panel by Kelly et al. (2000) revealed 14 cases in which two different ESTs that were likely to correspond to different regions of the same gene were mapped to the identical positions. We have removed one member of each of these putative duplicate pairs from the dataset.
Figure 1
Figure 1
Genetic linkage map of the zebrafish genome. The positions of 2119 polymorphic markers mapped in the heat shock (HS) panel are shown. Genes and expressed sequence tags (ESTs) with identified human orthologs are color coded according the chromosomal position of the human gene. Gene names are shown in bold type. According to zebrafish convention (http://zfin.org/zf_info/nomen.html), ESTs with putative human orthologs are named according to their human counterparts. Other ESTs are named by their GenBank accession numbers. Simple-sequence length polymorphism names begin with “Z” or “GOF”, following the nomenclature of Shimoda et al. (1999). This map reports revised positions for three genes, tbx6, isl3, and six7, that were assigned to different locations in previous maps (Postlethwait et al. 1998; Geisler et al. 1999; Kelly et al. 2000). In addition, we have revised two previous assignments (Kelly et al. 2000) for ESTs, and we have removed from the dataset eight ESTs that were originally mapped in the HS panel because of discrepancies detected in repeat genotype assays. Sequence comparisons of the ESTs mapped in the HS panel by Kelly et al. (2000) revealed 14 cases in which two different ESTs that were likely to correspond to different regions of the same gene were mapped to the identical positions. We have removed one member of each of these putative duplicate pairs from the dataset.
Figure 2
Figure 2
Oxford grids showing conservation of synteny among zebrafish, human, and mouse. Each dot represents an orthologous gene pair plotted by position in the two species compared. Boxes that contain more than one dot represent conserved syntenies. (A) Zebrafish–human comparison; (B) Zebrafish–mouse comparison; (C) Human–mouse comparison. Human and mouse orthologs of zebrafish genes mapped in the heat shock panel are listed in Table 1. Orthologs of genes mapped in previous work (Postlethwait et al. 1998; Gates et al. 1999) are also included in these grids. The genes in the zebrafish–human grid are summarized in Table 2. All genes in a Hox complex are represented by a single dot. All three grids clearly show a nonrandom distribution; χ2 values, calculated according to Gates et al. (1999) are: χ2 = 158, zebrafish–human; χ2 = 26.0, zebrafish–mouse; and χ2 = 220, human–mouse. For 1 degree of freedom, a χ2 >10.83 indicates a significant difference between a random distribution and the observed distribution at a significance level P <0.001. The map positions of zebrafish genes and expressed sequence tags summarized in the graphs were derived from this study and from previous work (Amores et al. 1998; Postlethwait et al. 1998; Gates et al. 1999; Kelly et al. 2000).
Figure 3
Figure 3
Maps showing gene order with conserved syntenic groups. (A) Maps showing 12 genes and expressed sequence tags (ESTs) on zebrafish linkage group LG 17 and the positions of their human counterparts on chromosome (Hsa) 14. (B) Maps showing 11 genes and ESTs on zebrafish LG 8 and the positions of their human counterparts on the short arm of Hsa 1. In both panels, the entire chromosome (thick line) is shown, but the scale is different in A and B. Names of zebrafish genes are shown; ESTs are listed by GenBank accession number.
Figure 4
Figure 4
Positions of duplicate chromosomal segments in the zebrafish genome. Each dot in the grid represents a pair of putative duplicate zebrafish genes plotted according to the map positions of the two genes. Boxes that contain multiple points represent putative duplicate chromosomal segments. Names, accession numbers, and positions of putative duplicate genes mapped in the heat shock (HS) panel and in previous work are summarized in Table 3. The distribution of points in the grid is distinctly nonrandom. The χ2 = 34.6, calculated according to Gates et al. (1999). For 1 degree of freedom, a χ2 >10.83 indicates a significant difference between a random distribution and the observed distribution at a significance level P <0.001. The map positions of zebrafish genes and ESTs summarized in the graph were derived from this study and from previous work (Amores et al. 1998; Postlethwait et al. 1998; Gates et al. 1999; Geisler et al. 1999; Kelly et al. 2000).

References

    1. Allendorf FW, Thorgaard GH. Tetraploidy and the evolution of salmonid fishes. In: Turner BJ, editor. Evolutionary Genetics of Fishes. New York: Plenum Press; 1984. pp. 1–46.
    1. Altschul SF, Madden TL, Schaffer AA, Zhang J, Zhang Z, Miller W, Lipman DJ. Gapped BLAST and PSI-BLAST: A new generation of protein database search programs. Nucleic Acids Res. 1997;25:3389–3402. - PMC - PubMed
    1. Amores A, Force A, Yan Y-L, Joly L, Amemiya C, Fritz A, Ho RK, Langeland J, Prince V, Wang YL, et al. Zebrafish hox clusters and vertebrate genome evolution. Science. 1998;282:1711–1714. - PubMed
    1. Brownlie A, Donovan A, Pratt SJ, Paw BH, Oates AC, Brugnara C, Witkowska HE, Sassa S, Zon LI. Positional cloning of the zebrafish sauternes gene: A model for congenital sideroblastic anaemia. Nat Genet. 1998;20:244–250. - PubMed
    1. Childs S, Weinstein BM, Mohideen M-APK, Donohue S, Bonkovsky H, Fishman MC. Zebrafish dracula encodes ferrochelatase and its mutation provides a model for erythropoietic protoporphyria. Curr Biol. 2000;10:1001–1004. - PubMed

Publication types

LinkOut - more resources