

The comparison of gene expression from multiple cDNA libraries
- PMID: 11116099
- PMCID: PMC313085
- DOI: 10.1101/gr.gr-1325rr
The comparison of gene expression from multiple cDNA libraries
Abstract
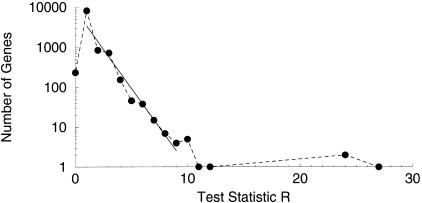
We describe a method for comparing the abundance of gene transcripts in cDNA libraries. This method allows for the comparison of gene expression in any number of libraries, in a single statistical analysis, to identify differentially expressed genes. Such genes may be of potential biological or pharmaceutical relevance. The formula that we derive is essentially the entropy of a partitioning of genes among cDNA libraries. This work goes beyond previously published analyses, which can either compare only two libraries, or identify a single outlier in a group of libraries. This work also addresses the problem of false positives associated with repeating the test on many thousands of genes. A randomization procedure is described that provides a quantitative measure of the degree of belief in the results; the results are further verified by considering a theoretically derived large deviations rate for the test statistic. As an example, the analysis is applied to four prostate cancer libraries from the Cancer Genome Anatomy Project. The analysis identifies biologically relevant genes that are differentially expressed in the different tumor cell types.
Figures
References
-
- Anderson L, Seilhamer J. A comparison of selected mRNA and protein abundances in the human liver. Electrophoresis. 1997;18:533–537. - PubMed
-
- Audic S, Claverie J-M. The significance of digital gene expression profiles. Genome Res. 1997;7:986–995. - PubMed
-
- Boguski MS, Schuler GD. ESTablishing a human transcript map. Nat Genet. 1995;10:369–371. - PubMed
-
- Bortoluzzi S, Danieli GA. Towards an in silico analysis of transcription patterns. Trends Genet. 1999;15:118–119. - PubMed
Publication types
MeSH terms
LinkOut - more resources
Full Text Sources
Other Literature Sources
Research Materials