. 2000 Dec 15;19(24):6814-22.
doi: 10.1093/emboj/19.24.6814.

Patterns of histone acetylation suggest dual pathways for gene activation by a bifunctional locus control region

Affiliations

Patterns of histone acetylation suggest dual pathways for gene activation by a bifunctional locus control region

F Elefant et al. EMBO J. .

Abstract

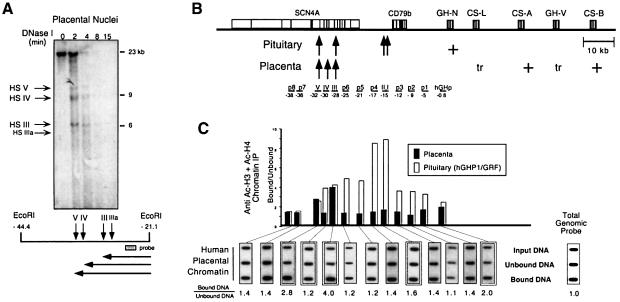
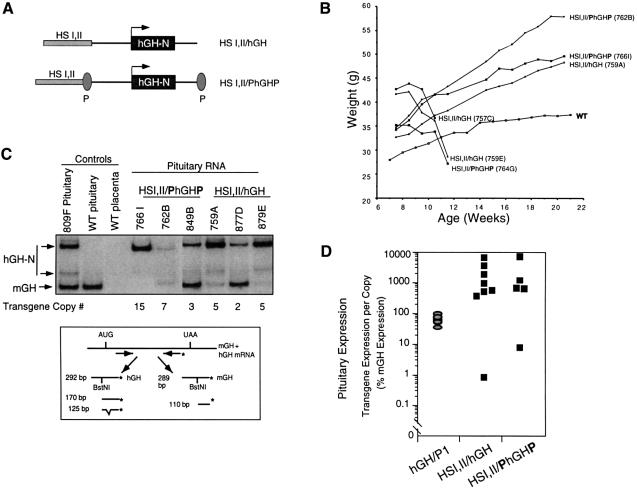
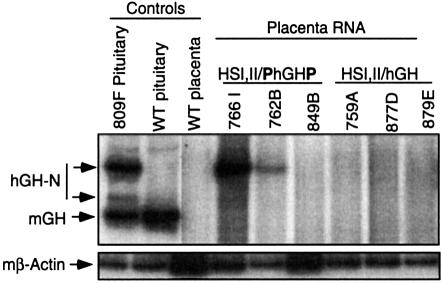
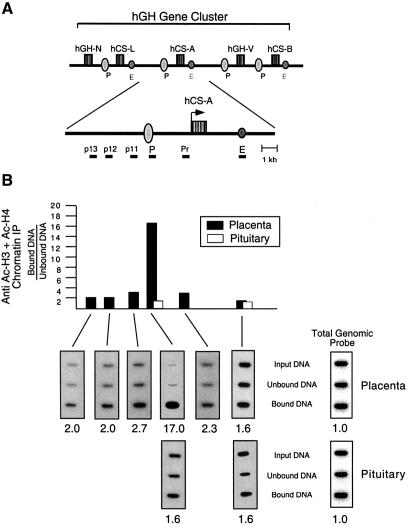
The five genes of the human growth hormone (hGH) cluster are expressed in either the pituitary or placenta. Activation of the cluster is dependent on a locus control region (LCR) comprising pituitary- specific (HSI,II, -15 kb), placenta-specific (HSIV, -30 kb) and shared (HSIII, -28 kb; HSV, -32 kb) DNase I hypersensitive sites. Gene activation in the pituitary is paralleled by acetylation of a 32 kb chromatin domain 5' to the cluster centered at HSI,II. In the present study we observed that acetylation of this region in placental chromatin was discretely limited to shared HSIII and HSV. Transgenic studies revealed placenta-specific activation of linked genes by a determinant (P-element) located 2 kb 5' to each of the four placentally expressed genes. A localized peak of histone acetylation was observed at these P-elements in placenta but not pituitary. These data support a model for bifunctional action of the hGH LCR in which separate positive determinants, HSI,II and the P-elements, activate their respective target genes by tissue-specific recruitment of distinctly regulated histone acetyl transferase activities.


Figures

None
Fig. 1. HSIII and HSV but not HSIV are enriched for acetylated histones in placental chromatin. (A) Placental chromatin contains three prominent DNase I hypersensitive sites, HSIII, HSIV and HSV, located between 28 and 32 kb 5′ to the hGH multigene cluster. Nuclei selectively isolated from the hCS-expressing syncytiotrophoblasts of a normal human term placenta were digested with DNase I for increasing periods of time (indicated above respective lanes in minutes). DNA was isolated at each time point, digested to completion with EcoRI and analyzed by Southern blotting using the 32P-labeled probe (represented diagrammatically in the map below the autoradiograph). The identity of the HS that resulted in the generation of each of the sub-bands is indicated to the left of the autoradiograph and the size markers are shown to the right. The diagram below the Southern blot illustrates the position of each DNase I HS site (vertical arrows) relative to the EcoRI-defined 3′ terminus. The horizontal lines represent the lengths of each corresponding sub-band. The coordinates represent the number of kilobases 5′ to the transcription start site of hGH-N. Three major HS (HSIII, HSIV and HSV) and a minor HS (IIIa) were detected. (B) Diagram of the hGH cluster and its LCR. A schematic representation of the hGH multigene cluster and its associated LCR are shown. The positions of the closely linked B-lymphocyte-specific CD79b gene (Bennani-Baiti et al., 1998b) and the striated muscle-specific SCN4A gene (Bennani-Baiti et al., 1995) are also indicated. The shaded rectangles represent each of the genes (labeled) and the vertical lines within each rectangle indicate their respective exons. The presence of HS in placenta or pituitary are indicated (arrows). The expression patterns of each gene are indicated as strong (+) or trace (tr). The probes used to map chromatin acetylation levels across this region are labeled and underlined below the diagram, and their coordinates relative to the transcription start site of hGH-N are indicated. Three probes correspond to segments between hGH-N and HSI,II (p1, p2 and p3 located at –5, –9 and –12 kb, respectively); three to segments between HSI,II and HSIII (p4, p5 and p6 located at –17, –21 and –25 kb, respectively); and two to segments 5′ of the LCR (p7 and p8 located at –36 and –38 kb, respectively). (C) Acetylation of the hGH LCR in human placental chromatin is limited to segments encompassing HSIII and HSV. Chromatin from nuclei selectively released from placental syncytiotrophoblasts (the chromatin preparation analyzed in Figure 1A) was subjected to ChIP analysis. Soluble nuclear chromatin was immunoprecipitated with a mixture of antisera specific to acetylated histones H3 and H4. Equal amounts of DNA purified from starting chromatin (Input DNA), unacetylated chromatin (Unbound DNA) and acetylated antibody-bound chromatin (Bound DNA) were applied to nylon membranes via a slot-blot manifold. The membranes were then sequentially hybridized with the 32P-labeled probes underlined in (B). The autoradiographs generated using hybridization probes corresponding to each HS of the hGH LCR (including the pituitary-specific HSI,II) and by the hGH-N promoter are doubly boxed. Ratios of hybridization signal intensities in the bound and unbound chromatin fractions were normalized to the corresponding ratios obtained using a loading control probe (Total Genomic Probe) and are indicated below each autoradiograph. The normalized ratios are summarized in the histogram. Each bar in the histogram is centered below its respective probe. Black histogram bars represent placental chromatin. This figure shows the ChIP analysis from one representative experiment using chromatin isolated from a single placental preparation shown in (A). All chromatin immunoprecipitations and slot-blot analyses reported were repeated twice with consistent results. White histogram bars represent previously published data obtained from analyses of transgenic mouse lines carrying the entire hGH LCR and linked hGH gene cluster on a P1 transgene (hGH/P1) (Elefant et al., 2000). These data are included to facilitate direct comparison with the placental study.
None
Fig. 2. The P-element fails to repress expression of hGH-N in the transgenic pituitary. (AHSI,II/hGH and HSI,II/PhGHP transgene constructs. The P-element, previously demonstrated to silence expression of linked genes in transfected pituitary-derived cell lines (Nachtigal et al., 1993), was inserted on either side of hGH-N in the context of the pituitary-specific HSI,II/hGH transgene to generate the HSI,II/PhGHP transgene. (B) Growth curves of mice containing the HSI,II/hGH or the derivative HSI,II/PhGHP transgenes. Body weights (ordinate) of each male founder transgenic for either transgene were monitored for 22 weeks (abscissa). Each growth curve is labeled with the respective transgene construct and identifying line number. The growth curve for a control, non-transgenic mouse is shown for comparison (WT). The three founders exhibiting the most extreme initial weights experienced rapid pre-morbid decreases in their body weights and died during the study period. (ChGH-N mRNA levels in the pituitaries of HSI,II/hGH or HSI,II/PhGHP transgenic mice. A diagram depicting the assay is shown below the autoradiograph. hGH-N and mGH mRNAs were co-amplified from pituitary RNA samples isolated from each of the indicated lines. The 32P-end-labeled (asterisk) PCR product was digested with BstNI to differentiate between the co-amplified mGH and hGH mRNA species (see Materials and methods for details). The identity of each band is indicated by the corresponding labeled arrows to the left of the gel. Analyses of mGH and hGH mRNA content in the pituitaries of three HSI,II/hGH and three HSI,II/PhGHP transgenic mice are shown. Three of the lines (849B, 877D and 879E) were generated subsequent to the growth curve experiment to compensate for founder deaths. Controls included mRNA from the pituitary of the mouse line expressing the hGH-N transgene (line 809F; Jones et al., 1995), mRNA isolated from a wild-type (WT) mouse pituitary (showing only the 110 bp mGH cDNA band) and mRNA from wild-type mouse placenta (showing no hGH-N or mGH expression). (D) Equivalent expression of HSI,II/hGH and HSI,II/PhGHP transgenes in the mouse pituitary. Band intensities in (C) were quantified by PhosphorImager (Molecular Dynamics) analyses and the levels of hGH-N mRNA for each line were normalized to both mGH mRNA and transgene copy numbers (hGH-N mRNA/transgene copy/mGH RNA = % mGH expression). This value represents the level of expression from a single transgene copy as a percentage of the expression of a single endogenous mGH gene (ordinate; logarithmic scale). These results are compared to previously documented, copy-number-dependent hGH-N expression in the pituitaries of mice carrying the hGHP1 transgene encompassing the entire hGH multigene cluster and LCR (gray ovals) (Su et al., 2000). Each data point represents expression from a single transgenic line with a unique transgene insertion site.
None
Fig. 3. The P-element activates hGH-N transgene expression in the mouse placenta. mRNA was isolated from the placentas of transgenic embryos derived from each of the six surviving transgenic lines and was analyzed for the presence of hGH-N mRNA by RT–PCR as described in Figure 2C. hGH-N expression was detected in two of three HSI,IIPhGHP line placentas (766I and 762B) and in none of three HSI,IIhGH line placentas. RT–PCR for mouse β-actin RNA served as control for RNA quality.
None
Fig. 4. The P-element displays a localized peak of hyperacetylation in placental chromatin. (A) Diagram of the 48 kb hGH multigene cluster with an enlargement of the hCS-A gene region. An expanded schematic of the hCS-A gene and flanking regions is provided to show the precise spacing of the probes used in this study. The conserved P-elements (P) are located 2 kb 5′ to each of the placentally expressed genes. A set of conserved enhancer elements (E) (Jiang and Eberhardt, 1997) are located 2 kb downstream from hCS-L, hCS-A and hCS-B. Due to the high level of sequence identity (92–98%) in the immediate flanking and intervening regions among these genes, we were unable to generate probes specific for each placental locus (see Materials and methods). Therefore, only p13 is specific for the hCS-A locus; each of the remaining probes hybridize to conserved regions adjacent to each of the placentally expressed genes (see Materials and methods). None of these probes, however, are represented elsewhere in the genome (confirmed by Southern blotting; data not shown). (B) Representative ChIP analyses of placental and pituitary chromatin at the hCS-A locus. Soluble nuclear chromatin prepared from each of the indicated sources was immunoprecipitated with anti-acetylated histone H3 and H4 antibodies, and analyzed as in Figure 2. All ratios were normalized to the ratio obtained using a probe for total genomic human DNA as a loading control (shown to the right). The normalized ratios detected in the bound versus unbound chromatin fractions are shown below each respective autoradiograph and are summarized in the histogram. The black histogram bars represent human placental chromatin. White histogram bars represent analysis of human pituitary chromatin at the P-element and enhancer regions.

Similar articles

Cited by

References

    1. Bennani-Baiti I.M., Jones,B.K., Liebhaber,S.A. and Cooke,N.E. (1995) Physical linkage of the human growth hormone gene cluster and the skeletal muscle sodium channel α-subunit gene (SCN4A) on chromosome 17. Genomics, 29, 647–652. - PubMed
    1. Bennani-Baiti I.M., Asa,S.L., Song,D., Iratni,R., Liebhaber,S.A. and Cooke,N.E. (1998a) DNase I-hypersensitive sites I and II of the human growth hormone locus control region are a major developmental activator of somatotrope gene expression. Proc. Natl Acad. Sci. USA, 95, 10655–10660. - PMC - PubMed
    1. Bennani-Baiti I.M., Cooke,N.E. and Liebhaber,S.A. (1998b) Physical linkage of the human growth hormone gene cluster and the CD79b (Igβ/B29) gene. Genomics, 48, 258–264. - PubMed
    1. Brem G., Wanke,R., Wolf,E., Buchmuller,T., Muller,M., Brenig,B. and Hermanns,W. (1989) Multiple consequences of human growth hormone expression in transgenic mice. Mol. Biol. Med., 6, 531–547. - PubMed
    1. Brownell J.E. and Allis,C.D. (1996) Special HATs for special occasions: linking histone acetylation to chromatin assembly and gene activation. Curr. Opin. Genet. Dev., 6, 176–184. - PubMed

Publication types