

Comparative Study
doi: 10.1093/emboj/19.24.6833.
Escherichia coli RNA polymerase core and holoenzyme structures
Affiliations
- PMID: 11118218
- PMCID: PMC305883
- DOI: 10.1093/emboj/19.24.6833
Item in Clipboard
Comparative Study
Escherichia coli RNA polymerase core and holoenzyme structures
EMBO J.
.
Abstract
Multisubunit RNA polymerase is an essential enzyme for regulated gene expression. Here we report two Escherichia coli RNA polymerase structures: an 11.0 A structure of the core RNA polymerase and a 9.5 A structure of the sigma(70) holoenzyme. Both structures were obtained by cryo-electron microscopy and angular reconstitution. Core RNA polymerase exists in an open conformation. Extensive conformational changes occur between the core and the holoenzyme forms of the RNA polymerase, which are largely associated with movements in ss'. All common RNA polymerase subunits (alpha(2), ss, ss') could be localized in both structures, thus suggesting the position of sigma(70) in the holoenzyme.
Figures
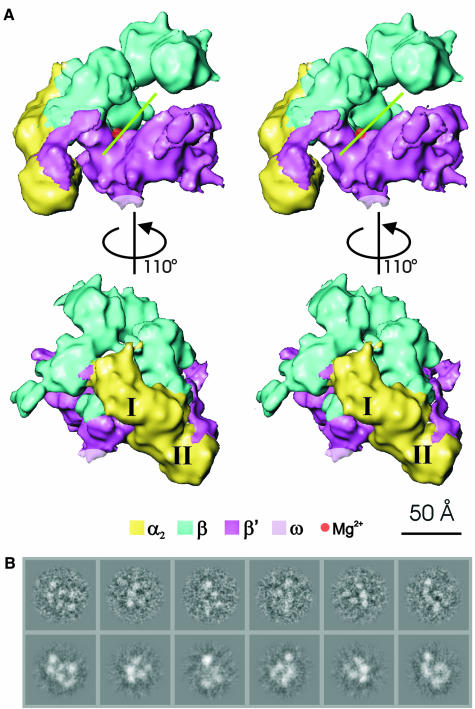
Fig. 1. Stereoviews of the E.coli core RNAp structure. (A) View approximately down the axis of the RNAp channel (top), illustrating the ‘crab claw’ shape. Each jaw of the claw consists primarily of a β or a β′ subunit. The green line indicates the orientation of the channel, which is thought to be a site of DNA interaction. The deduced position of the chelated Mg2+ ion at the active centre is indicated by the red sphere. (Bottom) Top view rotated about the vertical axis by 110° to reveal the distinctive shape of the NTD dimer and β flexible flap. The subunit locations were identified by applying subunit boundaries derived from those found in Taq core RNAp (see text). The subunits are colour coded as indicated. The two α subunits, αI and αII, are indicated. (B) Representative characteristic views used for core RNAp reconstruction are shown in the top row. Below are the reprojections of the Ec core RNAp along the Euler angle assigned to the characteristic view.
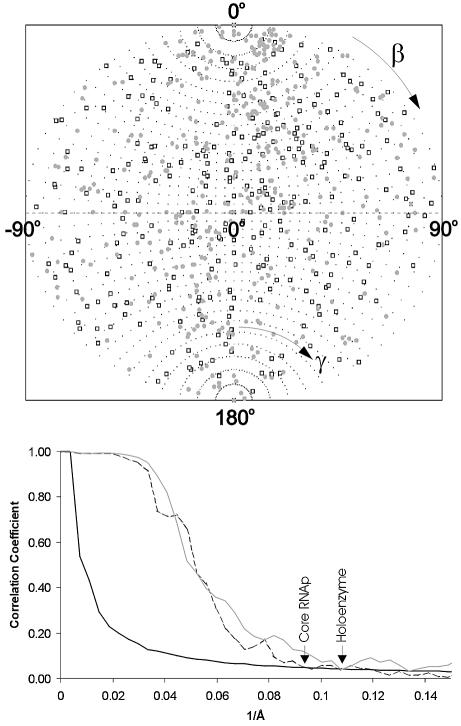
Fig. 2. Angular distributions and resolutions. (Top) Angular distribution of the class averages used for the final 3D reconstructions of Ec core RNAp (open square) and σ70 holoenzyme (grey circle). The ‘asymmetric triangles’ of these asymmetric structures covers the full unit sphere: the β angles range from 0° to 180°; the γ angles range from –90° to + 90°. (Bottom) Resolution of the 3D reconstructions determined by Fourier shell correlation (FSC). The first cross-over with the 3σ threshold curve (solid line) indicates the resolutions achieved in the experiments. The FSC function measures the normalized cross-correlation between two 3D reconstructions as a function of spatial frequency (see Materials and methods). The FSC from the Ec core RNAp reconstruction (dashed line) crosses the 3σ threshold at a spatial frequency of 0.093 Å–1 (10.75 Å), whereas the FSC from the σ70 holoenzyme reconstruction (grey line) crosses the 3σ threshold at a spatial frequency of 0.107 Å–1 (9.35 Å).
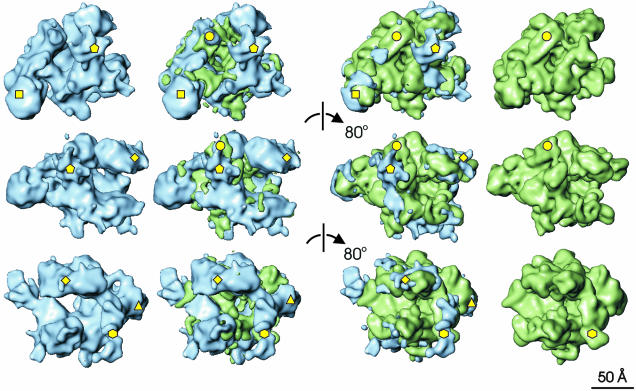
Fig. 3. Comparison of the E.coli and T.aquaticus core RNAps. Each row of this composite illustration shows surface rendered views of Ec core RNAp in blue (far left) and Taq core RNAp (far right). The difference map between Taq and Ec is shown in green and superimposed on Ec core RNAp (middle left). The difference map between Ec and Taq is shown in blue and superimposed on Taq core RNAp (middle right). Each successive row is related to the previous one by an 80° clockwise rotation about a vertical axis. The most significant differences between the two structures, discussed in detail in the main text, are marked by yellow shapes. Pentagon, Ec insertion in the C-terminus of β′; circle, β′ residues 945–977 (Taq); triangle, Ec β DRII insertion; diamond, β conserved regions A, B and C; hexagon, β flexible flap; square, αII-associated density.
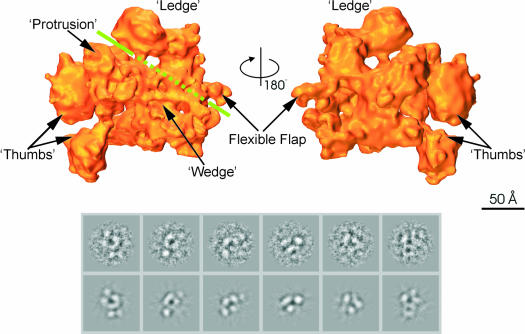
Fig. 4. Structure of E.coli σ70 holoenzyme. (Top) Surface views of the σ70 holoenzyme; the front view and back view are related through a 180° rotation around the vertical axis. Features discussed in the main text are labelled. The green line indicates the position of the groove. Where the line is dashed, the groove is obscured by the presence of the ‘wedge’-shaped density in front. (Bottom) Representative characteristic views used for core RNAp reconstruction. Below are the reprojections of the Ec holoenzyme along the Euler angle assigned to the characteristic view.
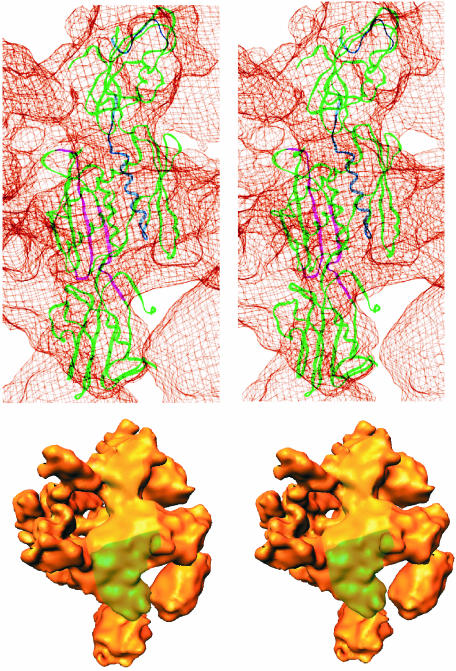
Fig. 5. Identification of the αNTD dimer in E.coli σ70 holoenzyme. (Top) Stereoview of the αNTD dimer within the Ec σ70 holoenzyme. The αNTD dimer backbone is represented by green ribbons, except for the αI residues protected from hydroxyl radical cleavage by the binding of β (shown in blue) and the αII residues protected by the binding of β′ (shown in magenta) (Heyduk et al., 1996). The holoenzyme density is shown in a ‘chicken wire’ representation. The αNTD fits well within the cryo-EM density, with the exception of the region of the αNTD dimer that interacts with β′. Some domain movement may be induced by the binding of β′. (Bottom) This stereoview of the back of σ70 holoenzyme illustrates the placement of the αNTD dimer. The holoenzyme is orientated such that the αNTD dimer is in a vertical orientation, comparable to its orientation in the chicken-wire model. The position of each αNTD subunit is indicated in colour: αI in yellow and αII in green.
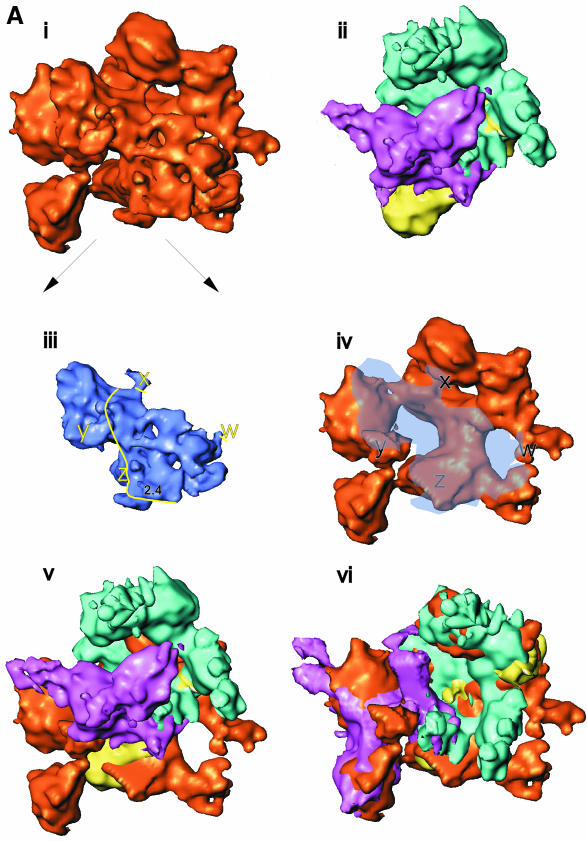
Fig. 6. Subunit locations and subunit movements upon σ70 binding. (A) The putative intermediates used to locate β and β′ subunits within the holoenzyme. See the main text for a detailed description. (i) Holoenzyme. (ii) Core RNAp (subunits coloured as in Figure 1). Both structures are orientated with the αNTD dimer along the ‘back-face’. (iii) Holoenzyme ‘wedge’ and ‘protrusion’ density made transparent for display purposes. After locating the positions of β and β′ subunits within the holoenzyme, it was possible to assign the wedge density to include σ70. The density we assign to σ70 is delineated by the yellow line (right). The positions marked w, x, y and z indicate likely core–σ70 subunit interaction regions. Also marked is the probable location of the –10 DNA interacting region of σ70, region 2.4. (iv) Holoenzyme with wedge and protrusion made translucent, to reveal masked structures. (v) The lack of overall superimposition of β and β′ between the aligned core RNAp and holoenzyme. By adjusting the positions (both rotationally and translationally) of β and β′ (also see B and C), superimposition was greatly enhanced (see vi). (vi) Placement of β and β′ (originating from the Ec core RNAp, but having been conformationally adjusted, see B and C) into the holoenzyme density. A single movement of β′ could not account for the holoenzyme position of β′ (see also C). One of the density matching rotations is shown in (vi). (v) and (vi) are displayed with transparent ‘wedge’ and ‘protrusion’ density, necessary to prevent this region of the holoenzyme obscuring the placement of β and β′ subunits within the holoenzyme. (B) Schematics of the conformation changes of the β subunit. The arrows indicate the deduced relative direction of movements in β. The locations of some of the conserved regions in β are indicated. The translationally aligned (but not rotational aligned) core (----) and holoenzyme (—) positions of each subunit are shown for β (left). After rotational alignment (right) of the β subunit, it became obvious that the β flexible flap was bent back by some 90° in the holoenzyme when compared with the core subunits, upon the binding of the σ70 subunit. (C) (left) A ribbon representation of β′ subunit (from Taq), demonstrating its modular domain organization. The positions of some conserved regions for β′ are indicated. This view was then rotated ∼120° about the vertical axis, then 15° in the plane of the page (middle), such that it is in the same location as the schematic of β′ (right). The aligned core (----) and holoenzyme (—) positions of each subunit are shown in for β′ (right). The position of the core β′ conserved regions are indicated (core locations). Arrows indicate the likely domain movements.
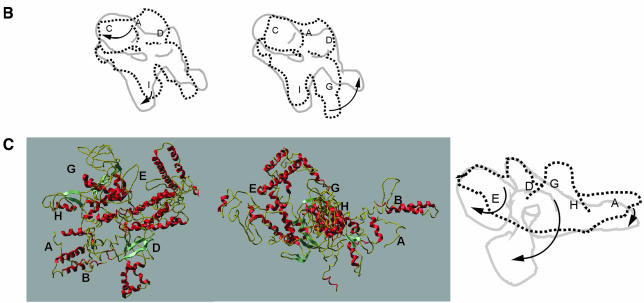
Fig. 6. Subunit locations and subunit movements upon σ70 binding. (A) The putative intermediates used to locate β and β′ subunits within the holoenzyme. See the main text for a detailed description. (i) Holoenzyme. (ii) Core RNAp (subunits coloured as in Figure 1). Both structures are orientated with the αNTD dimer along the ‘back-face’. (iii) Holoenzyme ‘wedge’ and ‘protrusion’ density made transparent for display purposes. After locating the positions of β and β′ subunits within the holoenzyme, it was possible to assign the wedge density to include σ70. The density we assign to σ70 is delineated by the yellow line (right). The positions marked w, x, y and z indicate likely core–σ70 subunit interaction regions. Also marked is the probable location of the –10 DNA interacting region of σ70, region 2.4. (iv) Holoenzyme with wedge and protrusion made translucent, to reveal masked structures. (v) The lack of overall superimposition of β and β′ between the aligned core RNAp and holoenzyme. By adjusting the positions (both rotationally and translationally) of β and β′ (also see B and C), superimposition was greatly enhanced (see vi). (vi) Placement of β and β′ (originating from the Ec core RNAp, but having been conformationally adjusted, see B and C) into the holoenzyme density. A single movement of β′ could not account for the holoenzyme position of β′ (see also C). One of the density matching rotations is shown in (vi). (v) and (vi) are displayed with transparent ‘wedge’ and ‘protrusion’ density, necessary to prevent this region of the holoenzyme obscuring the placement of β and β′ subunits within the holoenzyme. (B) Schematics of the conformation changes of the β subunit. The arrows indicate the deduced relative direction of movements in β. The locations of some of the conserved regions in β are indicated. The translationally aligned (but not rotational aligned) core (----) and holoenzyme (—) positions of each subunit are shown for β (left). After rotational alignment (right) of the β subunit, it became obvious that the β flexible flap was bent back by some 90° in the holoenzyme when compared with the core subunits, upon the binding of the σ70 subunit. (C) (left) A ribbon representation of β′ subunit (from Taq), demonstrating its modular domain organization. The positions of some conserved regions for β′ are indicated. This view was then rotated ∼120° about the vertical axis, then 15° in the plane of the page (middle), such that it is in the same location as the schematic of β′ (right). The aligned core (----) and holoenzyme (—) positions of each subunit are shown in for β′ (right). The position of the core β′ conserved regions are indicated (core locations). Arrows indicate the likely domain movements.
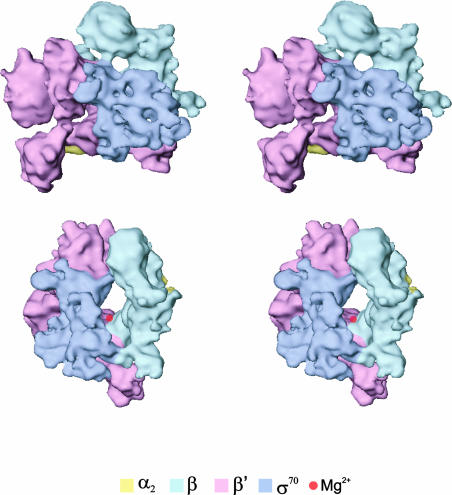
Fig. 7. Stereoviews of the σ70–holoenzyme. (Top) A front view of the holoenzyme, showing the subunit assignment (see text). The holoenzyme was then rotated about the vertical axis by ∼100° (clockwise), followed by rotation of 25° about the horizontal (bottom). The subunit assignments are coloured as indicated. The deduced position of the chelated Mg2+ ion at the active centre is indicated by the red sphere.
References
-
- Arthur T.M., Anthony,L.C. and Burgess,R.R. (2000) Mutational analysis of ‘β260–309’ a σ70 binding site located on E.coli core RNA polymerase. J. Biol. Chem., 275, 23113–23119. - PubMed
-
- Borukhov S. et al. (1991) Mapping of trypsin cleavage and antibody-binding sites and delineation of a dispensable domain in the β subunit of E.coli RNA polymerase. J. Biol. Chem., 266, 23921–23926. - PubMed
-
- Burgess R. and Jendrisak,J. (1975) A procedure for the rapid, large scale purification of E.coli DNA-dependent RNA polymerase involving polymin P precipitation and DNA–cellulose chromatography. Biochemistry, 14, 4634–4638. - PubMed
-
- Burgess R.R., Travers,A.A., Dunn,J.J. and Bautz,E.K.F. (1969) Factor stimulating transcription by RNA polymerase. Nature, 221, 43–44. - PubMed
Publication types
MeSH terms
Substances
LinkOut - more resources
Full Text Sources
Other Literature Sources
Molecular Biology Databases
