. 2000 Dec 15;529 Pt 3(Pt 3):625-46.
doi: 10.1111/j.1469-7793.2000.00625.x.

Calcium dynamics associated with action potentials in single nerve terminals of pyramidal cells in layer 2/3 of the young rat neocortex

Affiliations

Calcium dynamics associated with action potentials in single nerve terminals of pyramidal cells in layer 2/3 of the young rat neocortex

H J Koester et al. J Physiol. .

Abstract

Calcium dynamics associated with a single action potential (AP) were studied in single boutons of the axonal arbor of layer 2/3 pyramidal cells in the neocortex of young (P14-16) rats. We used fluorescence imaging with two-photon excitation and Ca2+-selective fluorescence indicators to measure volume-averaged Ca2+ signals. These rapidly reached a peak (in about 1 ms) and then decayed more slowly (tens to hundreds of milliseconds). Single APs and trains of APs reliably evoked Ca2+ transients in en passant boutons located on axon collaterals in cortical layers 2/3, 4 and 5, indicating that APs propagate actively and reliably throughout the axonal arbor. Branch point failures are unlikely to contribute to differences in synaptic efficacy and reliability in the connections made by layer 2/3 pyramidal cells. AP-evoked Ca2+ transients in boutons were mediated by voltage-dependent Ca2+ channels (VDCCs), predominantly by the P/Q- and N-subtypes. Ca2+ transients were, on average, of significantly larger amplitude in boutons than in the flanking segments of the axon collateral. Large amplitude Ca2+ transients in boutons were spatially restricted to within <= 3 m of axonal length. Single AP-evoked Ca2+ transients varied up to 10-fold across different boutons even if they were located on the same axon collateral. In contrast, variation of Ca2+ transients evoked by successive APs in a given single bouton was small (coefficient of variation, c.v. <= 0.21). Amplitudes of AP-evoked Ca2+ signals did not correlate with the distance of boutons from the soma. In contrast, AP-evoked Ca2+ signals in spines of basal dendrites decreased slightly (correlation coefficient, r2 = -0.27) with distance from the soma. Measurements with the low-affinity Ca2+ indicator Magnesium Green suggest that the volume-averaged residual free [Ca2+]i in a bouton increases on average by 500 nM following a single AP. Higher concentrations of indicator caused, on average, a decrease in the amplitude and an increase in the decay time constant of Ca2+ transients. Assuming a single-compartment model the concentration dependence of decay time constants suggests a low endogenous Ca2+ binding ratio close to 140, indicating that of the total Ca2+ influx ( approximately 2 fC) less than 1% remained free. The indicator concentration dependence of decay time constants further suggests that the residual free Delta[Ca2+]i associated with an AP decays with a time constant of about 60 ms (35 C) reflecting a high Ca2+ extrusion rate of about 2600 s(-1). The results show that AP-evoked volume-averaged Ca2+ transients in single boutons are evoked reliably and, on average, have larger amplitudes than Ca2+ transients in other subcellular compartments of layer 2/3 pyramidal cells. A major functional signature is the large variation in the amplitude of Ca2+ transients between different boutons. This could indicate that local interactions between boutons and different target cells modify the spatiotemporal Ca2+ dynamics in boutons and cause target cell-specific differences in their transmitter release properties.


Figures
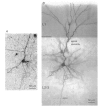
Figure 1
Figure 1. Comparison of layer 2/3 pyramidal cell dendritic and axonal arbor in fluorescence and bright-field image after biocytin-HRP staining
A, fluorescence image of a layer 2/3 pyramidal neuron using two-photon excitation imaging. The image is a patchwork of highlight projections through two stacks of 23 frames. The neuron was filled via a somatic patch pipette with the fluorescence indicator OGB-1 (200 μM). B, bright-field micrograph of the same neuron that was also filled during whole-cell recording with biocytin (3 mg ml−1) via the patch pipette, fixed and developed afterwards with biocytin-HRP conjugated to avidin.
Figure 2
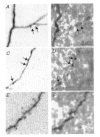
Figure 2. Comparison of subcellular axon and dendrite structures as observed with fluorescence imaging and bright-field microscopy of biocytin-HRP stained cells (same cell as in Fig. 1)
A and B, axon collateral branching from main axon (left). Fluorescence image (A) and micrograph of biocytin-HRP stained axon (B) of the middle region as indicated by frames in Fig. 1. The main axon (left) gives rise to a secondary branch and a branch point for third-order branches (arrows). C and D, en passant varicosities on axon collateral. Fluorescence image (C) and photomicrograph of biocytin-stained (D) axon collateral with several clearly visible en passant varicosities (arrows). Note that the brighter structures of the fluorescence image in C correspond to the ‘beads on a string’ structures of the biocytin staining in D. E and F, basal dendrite and dendritic spines. Panels show the regions (left frames) indicated in Fig. 1 at higher magnification. Spine-like protrusions colocalize in fluorescence and bright-field images.
Figure 3
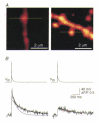
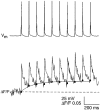
Figure 3. Comparison of Ca2+ transients evoked by an AP in a single bouton and a single spine of a layer 2/3 neuron
A, optical detection of boutons (left) and spines (right) in a pyramidal neuron. Scans of fluorescence change were made repetitively along the horizontal lines indicated. B, APs evoked by somatic current injection (400 pA, 5 ms) are shown in the upper traces. Lower traces show Ca2+ transients recorded in the bouton (left) and the spine (right) using OGB-1 (200 μM) as the indicator. Peak amplitudes were ΔF/F = 1.9 and 0.7, respectively. The decay of the transient in the bouton was fitted satisfactorily by superposition of two exponential functions (continuous lines, black and blue). The respective decay time constants were 29 and 290 ms. The transient decay in the spine was fitted satisfactorily with a single time constant of 370 ms.
Figure 4
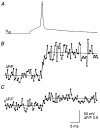
Figure 4. Fast rise time of AP-evoked Ca2+ transients in a single bouton
A, AP evoked by brief somatic current injection. B, fluorescence increase evoked by a single AP in a bouton of a layer 2/3 pyramidal cell loaded with OGB-1 (200 μM). Scan was made at a time resolution of 0.5 ms. Continous lines show the exponential fits to the rise- and decay time course. The rise time constant was 1.11 ms and the decay time constant was 590 ms. C, fluorescence increase evoked by single AP in a spine. The fitted rise time constant was 1.05 ms; the decay time constant was 660 ms.
Figure 5
Figure 5. Spatial extent of Ca2+ transients in boutons
A, fluorescence image of an en passant bouton of a layer 2/3 pyramidal cell axon collateral. B, amplitudes of AP-evoked Ca2+ transients in five different boutons. Individual recordings were made at centres of a boutons and at distances of 3 and 6 μm (○). The respective averages are shown as •. C, fluorescence image of spines of a basal dendrite. D, amplitudes of AP-evoked Ca2+ transients in centres of spines and at distances of 2 and 6 μm from the spine (○). The respective averages are shown as •.
Figure 6
Figure 6. Effect of specific Ca2+ channel subtype blockers on AP-evoked Ca2+ fluorescence transients in boutons and dendrites
A, averaged records of Ca2+ transients in boutons (left family of traces) and shafts of basal dendrites (right traces) before and after application of various VDCC subtype blockers. Time of AP is indicated by arrows. In each pair of traces the record with the lower amplitude is that recorded in the presence of blocker. Blockers used were the same as in Table 1. B, average effect of VDCC blockers in boutons (□) and shafts of basal dendrites (formula image). Error bars indicate s.d. *Significant difference between the effect of the various blockers on boutons and dendrites. The values listed in Table 1 are illustrated here in bar graphs.
Figure 7
Figure 7. Action potentials propagate reliably in the axonal arbor at low frequency
Left panel, fluorescence image of an axonal branch point. Distal to an axonal branch point on both higher-order branches a bouton was selected (circles) where an AP-evoked Ca2+ transient was detected. Right panel, top trace shows somatic recording of APs evoked by brief current injection. At low AP frequency the fluorescence increase evoked by single APs was detectable in both boutons (lower two traces). Cell was loaded with 200 μM OGB-1.
Figure 8
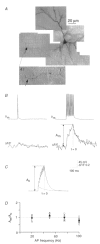
Figure 8. Action potentials propagate reliably in the axonal arbor at high frequency
A, bright-field image of a biocytin-stained pyramidal cell, illustrating the bouton (arrow) that was examined for fluorescence transients. B, a single AP (somatic recording, upper left trace) or a train of 10 APs (100 Hz) (upper right trace) evoked fluorescence transients (lower left and lower right traces). C, the fluorescence amplitude expected for the train of spikes (Ac) was calculated from the fluorescence response to a single AP. Ratio of Am/Ac was 0.91. D, boutons in different cells were tested for responses to AP trains of 20, 50, 75 and 100 Hz. The graph shows the ratio of the measured amplitude (Am) and the expected amplitude (Ac) for different frequencies (○). • represent the average ratio for a given AP frequency. Ratios Am/Ac were: 0.97 ± 0.24 (n = 3) for 20 Hz; 1.14 ± 0.12 (n = 3) for 50 Hz; 0.99 ± 0.21 (n = 5) for 75 Hz and 0.79 ± 0.17 (n = 7) for 100 Hz.
Figure 9
Figure 9. Time course of summation of AP-evoked Ca2+ transients and steady-state [Ca2+]i levels
Average Ca2+ fluorescence signal evoked by 10 Hz trains of APs made from recordings in 19 boutons of three pyramidal cells. The level of the fluorescence before each transient in the train is indicated by a dot. Steady state is reached with a time constant of 157 ms (single- exponential fit, continuous line).
Figure 15
Figure 15. Decay time constants of the AP-evoked Ca2+ transients in single boutons loaded with different concentrations of Magnesium Green
A, AP-evoked calcium transients in single boutons. Each trace is an average of 20 recordings in single boutons of different cells filled with 100 μM (left), 500 μM (middle) or 2000 μM (right) Magnesium Green. Continuous lines represent single-exponential fits of the fluorescence decay. Time constants were 37, 62 and 283 ms, amplitudes (ΔF/F) were 0.25, 0.16 and 0.10, respectively. B, distribution of decay time constants at different Magnesium Green concentrations measured in single boutons as shown in A. The peaks of Gaussian fits (continuous lines) were 47 ± 32, 50 ± 28 and 167 ± 124 ms. Mean decay time constants were 45, 70 and 211 ms. C, averages of all fluorescence recordings for each indicator concentration (100 μM, n = 16 boutons in five cells; 500 μM, 23 boutons in eight cells; 2000 μM, n = 13 boutons in three cells). Recordings were averaged over several boutons and cells to obtain the decay time constant. Decay time constants were 37, 73 and 180 ms. The amplitude decreased from ΔF/F = 0.16 (100 μM) to ΔF/F = 0.05 (2000 μM).
Figure 10
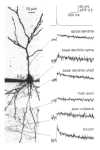
Figure 10. Comparison of Ca2+ transients in different subcellular compartments of a layer 2/3 pyramidal neuron
Left panel, fluorescence image of a layer 2/3 pyramidal neuron filled with OGB-1 (200 μM). Image is a highlight projection of a stack of 23 frames. The dark structure on the left is the whole-cell recording pipette. Right panel, Ca2+ transients evoked by a single AP. The top trace shows an AP evoked by brief somatic current injection. Traces below show the Ca2+ fluorescence transients evoked by a single AP in the different subcellular compartments as indicated. Each trace represents the average of 2-5 sweeps. The lines represent fits of single exponentials to the decay. Recovery in the bouton is fitted with two exponentials.
Figure 11
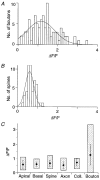
Figure 11. Range of peak amplitudes of Ca2+ transients in the different subcellular compartments of layer 2/3 pyramidal cells
A, distribution of peak amplitudes of Ca2+ transients evoked by single APs recorded in boutons. Continuous line represents a Gaussian fit (1.2 ± 1.0). B, distribution of AP-evoked peak amplitudes in spines of basal dendrites. Continuous line represents a Gaussian fit (0.6 ± 0.3). C, range of Ca2+ transients evoked by a single AP in the shaft of the proximal apical dendrite (Apical), in the shaft of basal dendrites (Basal), in spines of basal dendrites (Spine), in the main axon (Axon), in axon collateral segments in between boutons (Coll) and in boutons. • indicate the average amplitude with error bars ± 1 s.d. and formula imagethe range of amplitudes.
Figure 12
Figure 12. Variation of AP-evoked Ca2+ transients in boutons
Distribution of the normalized and pooled amplitudes of the fluorescence transients evoked by single APs recorded in 63 boutons (three sweeps each). Continuous line shows Gaussian fit. Mean, 1.0 ± 0.21.
Figure 13
Figure 13. Spatial profile of AP-evoked Ca2+ fluorescence transients in the axonal and basal dendritic arbor
A, fluorescence image of a layer 2/3 pyramid with a long horizontal axon collateral. AP-evoked Ca2+ transients in single boutons (shown as traces below the image) were mapped along this branch as indicated by the circles. B, amplitude of the AP-evoked Ca2+ transient in boutons of axon collaterals. Graph shows amplitudes of the Ca2+ fluorescence transients evoked by one AP plotted against the geometric distance from soma, indicating lack of correlation (r2 = 0.05). Note that axonal length is longer than geometric distance. C, amplitude of the AP-evoked Ca2+ signal in basal dendrites. Amplitude of AP-evoked Ca2+ transients in spines of a basal dendrite. The amplitude decreased with distance (r2 = -0.27).
Figure 14
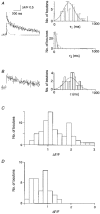
Figure 14. Double- and single- exponential decay time course of AP-evoked Ca2+ transients in boutons
A, AP-evoked Ca2+ transient recorded in a bouton loaded with OGB-1 (200 μM). The decay could be fitted satisfactory with the sum of two exponentials (time constants were 552 and 40 ms). Histograms on the right show the distribution of the slow (τ1) and fast (τ2) time constants of recordings in 68 boutons. The Gaussian fits yielded 353 ± 190 ms and 22 ± 48 ms. B, calcium transient in a bouton with a single-exponential decay. The time constant is 519 ms. Histogram on the right shows the distribution of recordings in 16 boutons, where the decay was fitted with a single exponential. Mean, 402 ± 214 ms. C and D, amplitude distribution of Ca2+ transients with a double-exponential decay (C) and amplitudes of transients with a single-exponential decay (D).
Figure 16
Figure 16. Estimate of the average endogenous Ca2+ binding ratio of boutons in axon collaterals and basal dendrites of layer 2/3 pyramidal cells
A, the decay time constants of Ca2+ transients in boutons loaded with different indicator concentrations (•, Magnesium Green; ○, Oregon Green) are plotted against the exogenous incremental Ca2+ binding ratios κB. The straight line represents a linear regression. The decay time constant of Ca2+ transients in a naive bouton is on average 56 ms, the endogenous Ca2+ binding ratio is 141, from X- and Y-axis intercepts of regression line. B, decay time constants of Ca2+ transients in basal dendrites (•, Magnesium Green; ○, Oregon Green) plotted against the exogenous Ca2+ binding ratios κ′B. The decay time constant of Ca2+ transients in basal dendrites is 57 ms and the endogenous Ca2+ binding ratio is 112.

References

    1. Borst JGG, Sakmann B. Calcium influx and transmitter release in a fast CNS synapse. Nature. 1996;383:431–434. - PubMed
    1. Borst JGG, Sakmann B. Calcium current during a single action potential in a large presynaptic terminal of the rat brainstem. The Journal of Physiology. 1998;506:143–157. - PMC - PubMed
    1. Christie BR, Eliot LS, Ito K, Miyakawa H, Johnston D. Different Ca2+ channels in soma and dendrites of hippocampal pyramidal neurons mediate spike-induced Ca2+ influx. Journal of Neurophysiology. 1995;73:2553–2557. - PubMed
    1. Debanne D, Guérineau NC, Gähwiler BH, Thompson SM. Action-potential propagation by an axonal IA-like K+ conductance in hippocampus. Nature. 1997;389:286–289. - PubMed
    1. Denk W, Strickler JH, Webb WW. Two-photon laser scanning fluorescence microscopy. Science. 1990;248:73–76. - PubMed

Publication types

MeSH terms

LinkOut - more resources