

In vitro responsiveness of gammadelta T cells from Mycobacterium bovis-infected cattle to mycobacterial antigens: predominant involvement of WC1(+) cells
- PMID: 11119493
- PMCID: PMC97859
- DOI: 10.1128/IAI.69.1.89-96.2001
In vitro responsiveness of gammadelta T cells from Mycobacterium bovis-infected cattle to mycobacterial antigens: predominant involvement of WC1(+) cells
Abstract
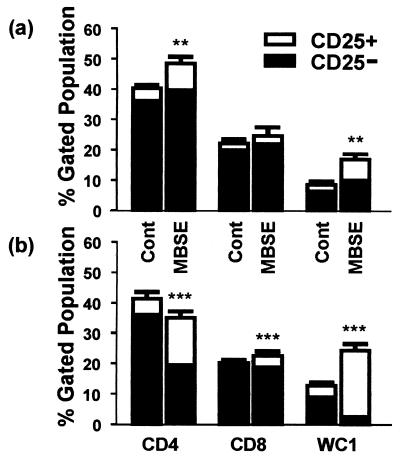
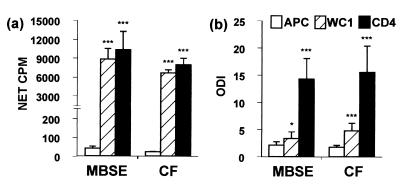
It is generally accepted that protective immunity against tuberculosis is generated through the cell-mediated immune (CMI) system, and a greater understanding of such responses is required if better vaccines and diagnostic tests are to be developed. gammadelta T cells form a major proportion of the peripheral blood mononuclear cells (PBMC) in the ruminant system and, considering data from other species, may have a significant role in CMI responses in bovine tuberculosis. This study compared the in vitro responses of alphabeta and gammadelta T cells from Mycobacterium bovis-infected and uninfected cattle. The results showed that, following 24 h of culture of PBMC with M. bovis-derived antigens, the majority of gammadelta T cells from infected animals became highly activated (upregulation of interleukin-2R), while a lower proportion of the alphabeta T-cell population showed activation. Similar responses were evident to a lesser degree in uninfected animals. Study of the kinetics of this response showed that gammadelta T cells remained significantly activated for at least 7 days in culture, while activation of alphabeta T cells declined during that period. Subsequent analysis revealed that the majority of activated gammadelta T cells expressed WC1, a 215-kDa surface molecule which is not expressed on human or murine gammadelta T cells. Furthermore, in comparison with what was found for CD4(+) T cells, M. bovis antigen was found to induce strong cellular proliferation but relatively little gamma interferon release by purified WC1(+) gammadelta T cells. Overall, while the role of these cells in protective immunity remains unclear, their highly activated status in response to M. bovis suggests an important role in antimycobacterial immunity, and the ability of gammadelta T cells to influence other immune cell functions remains to be elucidated, particularly in relation to CMI-based diagnostic tests.
Figures


Similar articles
-
Comparative analysis of WC1.1+ and WC1.2+ γδ T cell subset responses from cattle naturally infected with Mycobacterium bovis to repeat stimulation with mycobacterial antigens.PLoS One. 2024 Dec 12;19(12):e0311854. doi: 10.1371/journal.pone.0311854. eCollection 2024. PLoS One. 2024. PMID: 39666627 Free PMC article.
-
Responses of bovine WC1(+) gammadelta T cells to protein and nonprotein antigens of Mycobacterium bovis.Infect Immun. 2002 Nov;70(11):6114-20. doi: 10.1128/IAI.70.11.6114-6120.2002. Infect Immun. 2002. PMID: 12379688 Free PMC article.
-
Specific recognition of mycobacterial protein and peptide antigens by γδ T cell subsets following infection with virulent Mycobacterium bovis.J Immunol. 2014 Mar 15;192(6):2756-69. doi: 10.4049/jimmunol.1302567. Epub 2014 Feb 14. J Immunol. 2014. PMID: 24532582
-
The role of gamma delta T cells in immunity to Mycobacterium bovis infection in cattle.Vet Immunol Immunopathol. 2014 Jun 15;159(3-4):133-43. doi: 10.1016/j.vetimm.2014.02.010. Epub 2014 Feb 24. Vet Immunol Immunopathol. 2014. PMID: 24636303 Review.
-
The WC1(+) gammadelta T-cell population in cattle: a possible role in resistance to intracellular infection.Vet Immunol Immunopathol. 2002 Oct 28;89(3-4):105-14. doi: 10.1016/s0165-2427(02)00200-3. Vet Immunol Immunopathol. 2002. PMID: 12383642 Review.
Cited by
-
Protective killed Leptospira borgpetersenii vaccine induces potent Th1 immunity comprising responses by CD4 and gammadelta T lymphocytes.Infect Immun. 2001 Dec;69(12):7550-8. doi: 10.1128/IAI.69.12.7550-7558.2001. Infect Immun. 2001. PMID: 11705932 Free PMC article.
-
Tuberculosis immunity: opportunities from studies with cattle.Clin Dev Immunol. 2011;2011:768542. doi: 10.1155/2011/768542. Epub 2010 Dec 6. Clin Dev Immunol. 2011. PMID: 21197095 Free PMC article. Review.
-
Comparative analysis of WC1.1+ and WC1.2+ γδ T cell subset responses from cattle naturally infected with Mycobacterium bovis to repeat stimulation with mycobacterial antigens.PLoS One. 2024 Dec 12;19(12):e0311854. doi: 10.1371/journal.pone.0311854. eCollection 2024. PLoS One. 2024. PMID: 39666627 Free PMC article.
-
Responses of bovine WC1(+) gammadelta T cells to protein and nonprotein antigens of Mycobacterium bovis.Infect Immun. 2002 Nov;70(11):6114-20. doi: 10.1128/IAI.70.11.6114-6120.2002. Infect Immun. 2002. PMID: 12379688 Free PMC article.
-
Interpretation of the gamma interferon test for diagnosis of subclinical paratuberculosis in cattle.Clin Diagn Lab Immunol. 2002 Mar;9(2):453-60. doi: 10.1128/cdli.9.2.453-460.2002. Clin Diagn Lab Immunol. 2002. PMID: 11874893 Free PMC article.
References
-
- Amadori M, Archetti I, Verardi R, Berneri C. Role of distinct population of bovine γδ T cells in the immune response to viral agents. Viral Immunol. 1995;8:81–91. - PubMed
-
- Andersen P, Askgaard D, Gottschau A, Bennedsen J, Nagai S, Heron I. Identification of immunodominant antigens during infection with Mycobacterium tuberculosis. Scand J Immunol. 1992;36:823–831. - PubMed
-
- Barnes P F, Grisso C L, Abrams J S, Band H, Rea T H, Modlin R L. γδ T lymphocytes in human tuberculosis. J Infect Dis. 1992;165:506–512. - PubMed
Publication types
MeSH terms
Substances
LinkOut - more resources
Full Text Sources
Research Materials
