

Defining the atherogenicity of large and small lipoproteins containing apolipoprotein B100
- PMID: 11120757
- PMCID: PMC387257
- DOI: 10.1172/JCI10695
Defining the atherogenicity of large and small lipoproteins containing apolipoprotein B100
Abstract
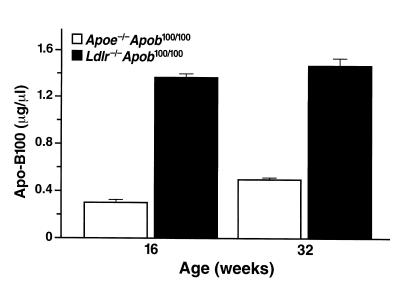
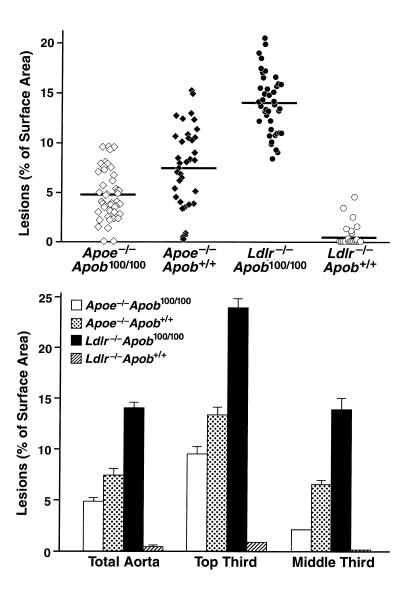
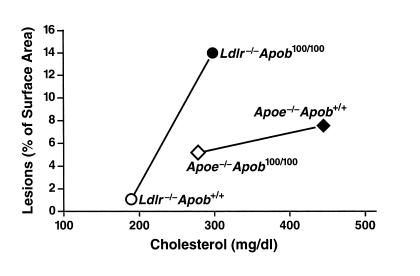
Apo-E-deficient apo-B100-only mice (APOE:(-/-)APOB:(100/100)) and LDL receptor-deficient apo-B100-only mice (LDLR:(-/-)APOB:(100/100)) have similar total plasma cholesterol levels, but nearly all of the plasma cholesterol in the former animals is packaged in VLDL particles, whereas, in the latter, plasma cholesterol is found in smaller LDL particles. We compared the apo-B100-containing lipoprotein populations in these mice to determine their relation to susceptibility to atherosclerosis. The median size of the apo-B100-containing lipoprotein particles in APOE:(-/-)APOB:(100/100) plasma was 53.4 nm versus only 22.1 nm in LDLR:(-/-)APOB:(100/100) plasma. The plasma levels of apo-B100 were three- to fourfold higher in LDLR:(-/-)APOB:(100/100) mice than in APOE:(-/-)APOB:(100/100) mice. After 40 weeks on a chow diet, the LDLR:(-/-)APOB:(100/100) mice had more extensive atherosclerotic lesions than APOE:(-/-)APOB:(100/100) mice. The aortic DNA synthesis rate and the aortic free and esterified cholesterol contents were also higher in the LDLR:(-/-)APOB:(100/100) mice. These findings challenge the notion that all non-HDL lipoproteins are equally atherogenic and suggest that at a given cholesterol level, large numbers of small apo-B100-containing lipoproteins are more atherogenic than lower numbers of large apo-B100-containing lipoproteins.
Figures


Similar articles
-
Lipoprotein size and atherosclerosis susceptibility in Apoe(-/-) and Ldlr(-/-) mice.Arterioscler Thromb Vasc Biol. 2001 Oct;21(10):1567-70. doi: 10.1161/hq1001.097780. Arterioscler Thromb Vasc Biol. 2001. PMID: 11597927 Review.
-
Lipoprotein clearance mechanisms in LDL receptor-deficient "Apo-B48-only" and "Apo-B100-only" mice.J Clin Invest. 1998 Oct 15;102(8):1559-68. doi: 10.1172/JCI4164. J Clin Invest. 1998. PMID: 9788969 Free PMC article.
-
Susceptibility to atherosclerosis in mice expressing exclusively apolipoprotein B48 or apolipoprotein B100.J Clin Invest. 1997 Jul 1;100(1):180-8. doi: 10.1172/JCI119511. J Clin Invest. 1997. PMID: 9202070 Free PMC article.
-
Overexpression of low density lipoprotein receptor eliminates apolipoprotein B100-containing lipoproteins from circulation and markedly prevents early atherogenesis in apolipoprotein E-deficient mice.Atherosclerosis. 2000 Dec;153(2):295-302. doi: 10.1016/s0021-9150(00)00414-7. Atherosclerosis. 2000. PMID: 11164418
-
Lipoprotein size and susceptibility to atherosclerosis--insights from genetically modified mouse models.Curr Drug Targets. 2008 Mar;9(3):174-89. doi: 10.2174/138945008783755629. Curr Drug Targets. 2008. PMID: 18336235 Free PMC article. Review.
Cited by
-
Decreased atherosclerosis in CX3CR1-/- mice reveals a role for fractalkine in atherogenesis.J Clin Invest. 2003 Feb;111(3):333-40. doi: 10.1172/JCI15555. J Clin Invest. 2003. PMID: 12569158 Free PMC article.
-
Induction of fatal inflammation in LDL receptor and ApoA-I double-knockout mice fed dietary fat and cholesterol.Am J Pathol. 2003 Sep;163(3):1201-13. doi: 10.1016/S0002-9440(10)63480-3. Am J Pathol. 2003. PMID: 12937162 Free PMC article.
-
Hepatic Tm6sf2 overexpression affects cellular ApoB-trafficking, plasma lipid levels, hepatic steatosis and atherosclerosis.Hum Mol Genet. 2017 Jul 15;26(14):2719-2731. doi: 10.1093/hmg/ddx159. Hum Mol Genet. 2017. PMID: 28449094 Free PMC article.
-
Consuming High-Fat and Low-Fat Ground Beef Depresses High-Density and Low-Density Lipoprotein Cholesterol Concentrations, and Reduces Small, Dense Low-Density Lipoprotein Particle Abundance.Nutrients. 2023 Jan 10;15(2):337. doi: 10.3390/nu15020337. Nutrients. 2023. PMID: 36678207 Free PMC article. Clinical Trial.
-
Animal models of diabetic macrovascular complications: key players in the development of new therapeutic approaches.J Diabetes Res. 2015;2015:404085. doi: 10.1155/2015/404085. Epub 2015 Feb 15. J Diabetes Res. 2015. PMID: 25785279 Free PMC article. Review.
References
-
- Grundy SM. Cholesterol and coronary heart disease. A new era. JAMA. 1986;256:2849–2858. - PubMed
-
- Krauss RM. Atherogenicity of triglyceride-rich lipoproteins. Am J Cardiol. 1998;81:13B–17B. - PubMed
-
- Shaikh M, et al. Quantitative studies of transfer in vivo of low density, Sf 12–60, and Sf 60–400 lipoproteins between plasma and arterial intima in humans. Arterioscler Thromb. 1991;11:569–577. - PubMed
-
- Goldstein, J.L., Hobbs, H.H., and Brown, M.S. 1995. Familial hypercholesterolemia. In The Metabolic and molecular bases of inherited disease. 7th edition. Volume 2. C.R. Scriver, A.L. Beaudet, W.S. Sly, and D. Valle, editors. McGraw-Hill. New York, New York, USA. 1981–2030.
-
- Mahley, R.W., and Rall, S.C., Jr. 1995. Type III hyperlipoproteinemia (dysbetalipoproteinemia): the role of apolipoprotein E in normal and abnormal lipoprotein metabolism. In The Metabolic and molecular bases of inherited disease. 7th edition. C.R. Scriver, A.L. Beaudet, W.S. Sly, and D. Valle, editors. McGraw-Hill. New York, New York, USA. 1953–1980.
Publication types
MeSH terms
Substances
Grants and funding
LinkOut - more resources
Full Text Sources
Other Literature Sources
Molecular Biology Databases
Miscellaneous
