. 2000 Dec 18;192(12):1719-30.
doi: 10.1084/jem.192.12.1719.

T cell receptor (TCR)-mediated repertoire selection and loss of TCR vbeta diversity during the initiation of a CD4(+) T cell response in vivo

Affiliations

T cell receptor (TCR)-mediated repertoire selection and loss of TCR vbeta diversity during the initiation of a CD4(+) T cell response in vivo

M Fassò et al. J Exp Med. .

Abstract

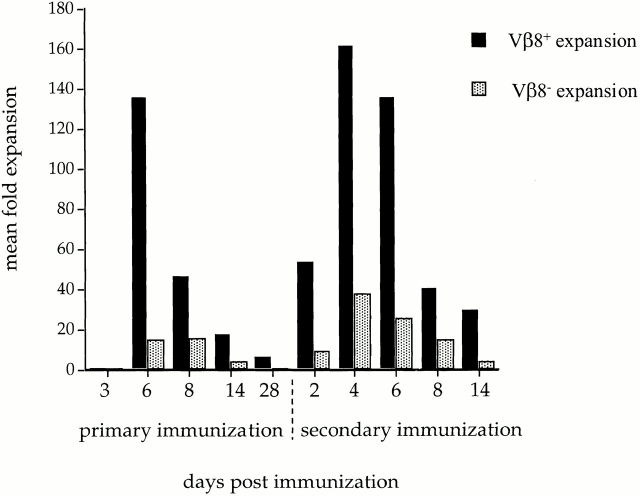
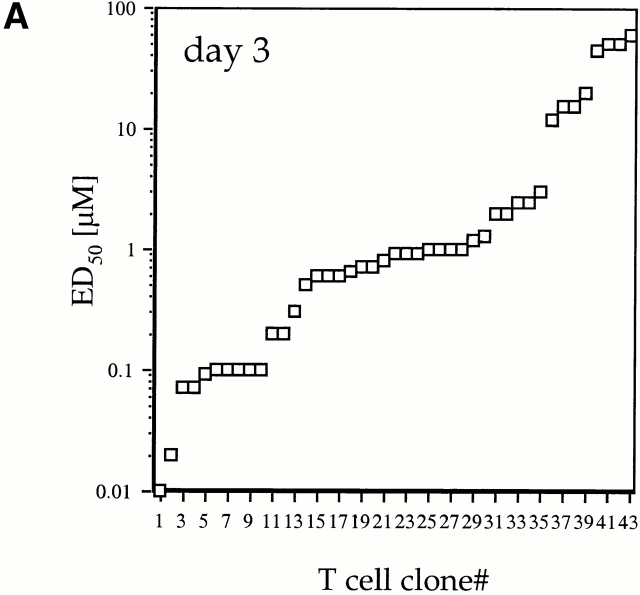
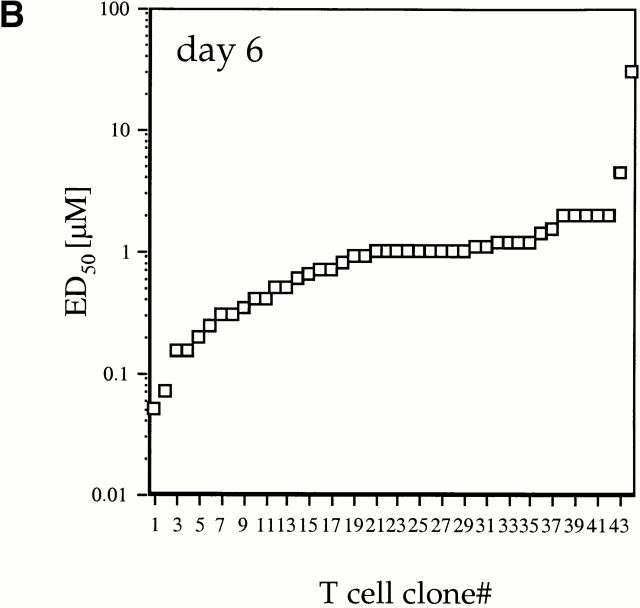
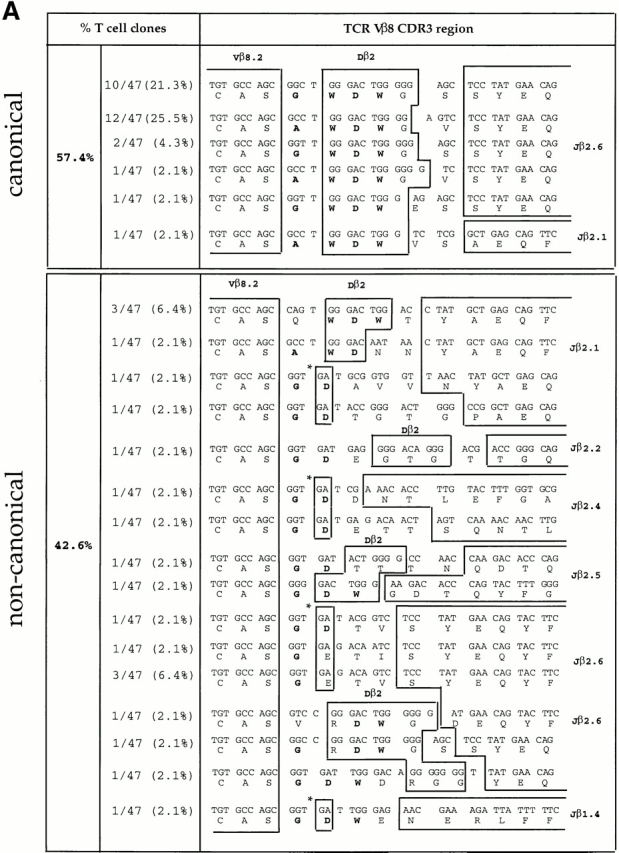
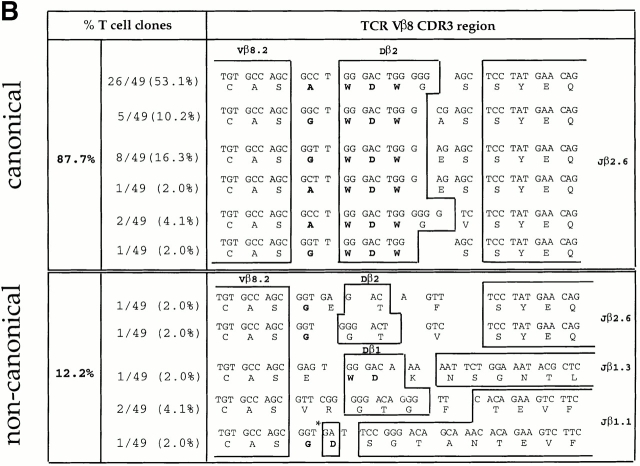
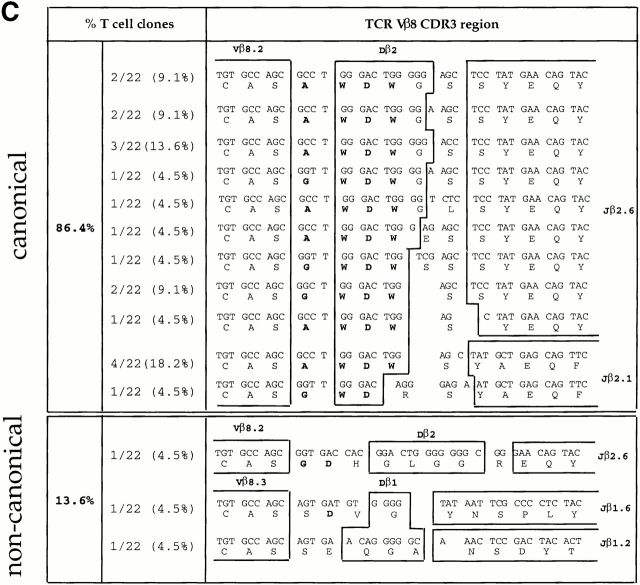
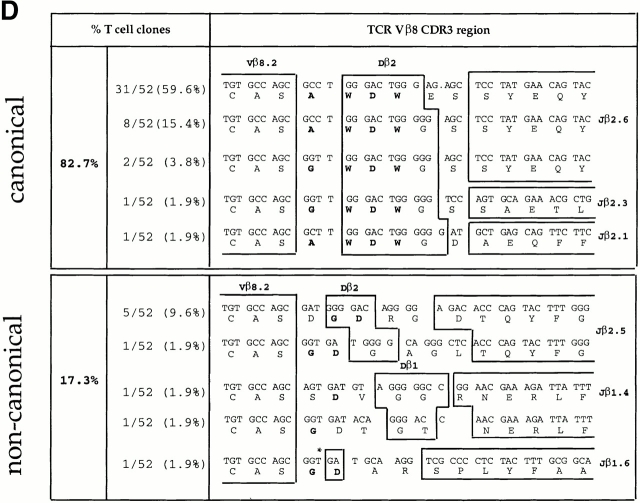
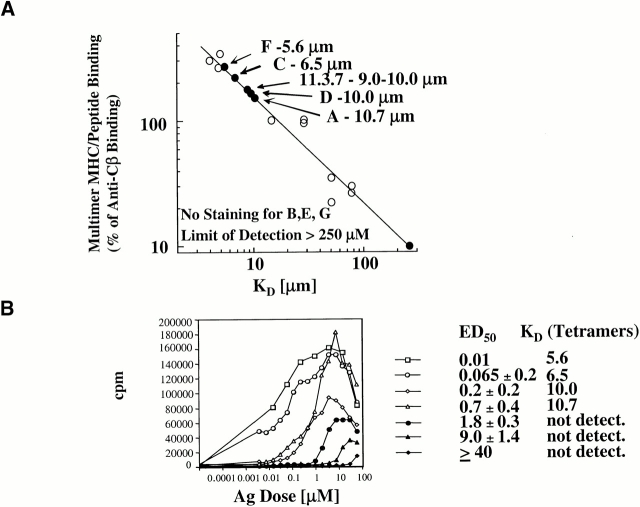
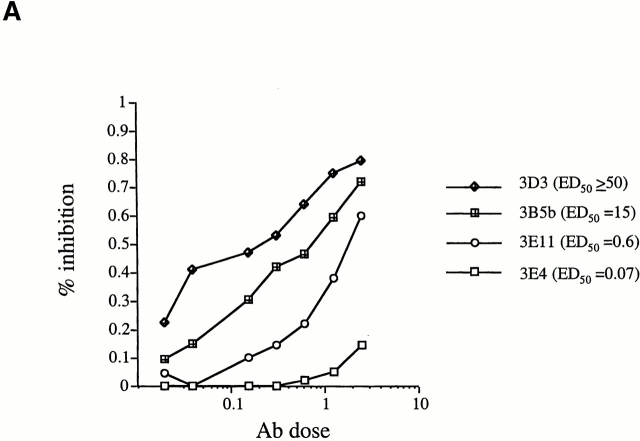
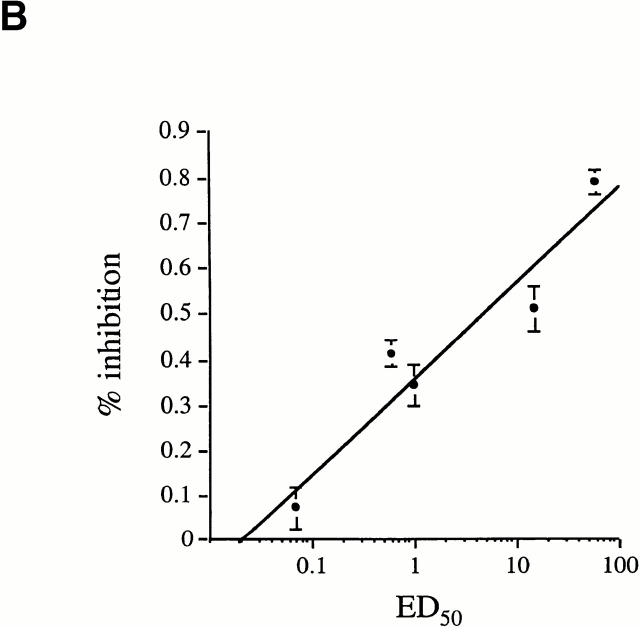
We recently described a novel way to isolate populations of antigen-reactive CD4(+) T cells with a wide range of reactivity to a specific antigen, using immunization with a fixed dose of nominal antigen and FACS((R)) sorting by CD4(high) expression. Phenotypic, FACS((R)), functional, antibody inhibition, and major histocompatibility complex-peptide tetramer analyses, as well as T cell receptor Vbeta sequence analyses, of the antigen-specific CD4(high) T cell populations demonstrated that a diverse sperm whale myoglobin 110-121-reactive CD4(+) T cell repertoire was activated at the beginning (day 3 after immunization) of the immune response. Within 6 d of immunization, lower affinity clones were lost from the responding population, leaving an expanded population of oligoclonal, intermediate affinity (and residual high affinity) T cells. This T cell subset persisted for at least 4 wk after immunization and dominated the secondary immune response. These data provide evidence that CD4(+) T cell repertoire selection occurs early in the immune response in vivo and suggest that persistence and expansion of a population of oligoclonal, intermediate affinity T cells is involved in CD4(+) T cell memory.


Figures

Figure 1
Figure 1
Kinetics of antigen-specific precursor frequencies during the primary and secondary response in vivo. Mean fold expansion of antigen-specific CD4high Vβ8+ and Vβ8 T cells during the primary and memory response to SWM 110–121, starting at day 3 after primary immunization for the baseline precursor frequency. The total number of antigen-specific T cells present at each given time point was determined by LDA as shown in Table and described in Materials and Methods. The mean total number of antigen-specific T cells used to determine the expansion of antigen-specific T cells was the result of two or three independent LDA experiments. The expansion was then calculated by dividing the mean total number of antigen-specific T cells present on a given day by the number of antigen-specific precursor cells present in day 3 cultures after primary immunization.
Figure 2
Figure 2
Distribution of ED50 values in CD4high LDA T cell clones. CD4highVβ8+ cells sorted from primed LNs 3 and 6 d after primary immunization were expanded from limiting dilution cultures. For each selected time point, T cell clones were derived from three independent immunizations. (A) 44 LDA clones derived from day 3 and (B) 44 LDA clones derived from day 6 cultures after primary immunization were tested for proliferative response, and the mean ED50 values were plotted in rank order. Each LDA clone was tested at least twice (SEM ≤ 10%) in order to determine a mean ED50 (as described in Materials and Methods).
Figure 2
Figure 2
Distribution of ED50 values in CD4high LDA T cell clones. CD4highVβ8+ cells sorted from primed LNs 3 and 6 d after primary immunization were expanded from limiting dilution cultures. For each selected time point, T cell clones were derived from three independent immunizations. (A) 44 LDA clones derived from day 3 and (B) 44 LDA clones derived from day 6 cultures after primary immunization were tested for proliferative response, and the mean ED50 values were plotted in rank order. Each LDA clone was tested at least twice (SEM ≤ 10%) in order to determine a mean ED50 (as described in Materials and Methods).
Figure 3
Figure 3
TCR Vβ CDR3 sequence analysis of CD4high LDA T cell clones. CD4highVβ8+ cells sorted from the primed LNs at days 3, 6, and 28 after primary immunization and at day 4 after secondary immunization with SWM 110–121 were expanded from limiting dilution cultures. For each selected time point, T cell clones were derived from three independent immunizations. TCR Vβ CDR3 sequence analysis was performed on (A) 47 LDA clones from day 3, (B) 49 LDA clones from day 6, (C) 22 LDA clones from day 28 after primary immunization, and (D) 52 LDA clones from day 4 after secondary immunization. Each clone was tested for antigen specificity in a proliferation assay (Fig. 4, and data not shown). The alignment is based on common use of the Vβ8 segment. Boxes separate germline sequences from N-region additions. Each TCR Dβ and Jβ assignment is displayed next to the corresponding sequence. The predicted amino acid sequence is displayed below each corresponding sequence. Sequences which contain the CDR3 amino acid composition (A/G)WDWx(x) (in bold) are listed as canonical; the other sequences are considered noncanonical. The numbers of clones displaying a particular clonotypic sequence as well as percentages of canonical and noncanonical sequences are listed. *No assignment to either a Dβ1 or a Dβ2 germline sequence could be made.
Figure 3
Figure 3
TCR Vβ CDR3 sequence analysis of CD4high LDA T cell clones. CD4highVβ8+ cells sorted from the primed LNs at days 3, 6, and 28 after primary immunization and at day 4 after secondary immunization with SWM 110–121 were expanded from limiting dilution cultures. For each selected time point, T cell clones were derived from three independent immunizations. TCR Vβ CDR3 sequence analysis was performed on (A) 47 LDA clones from day 3, (B) 49 LDA clones from day 6, (C) 22 LDA clones from day 28 after primary immunization, and (D) 52 LDA clones from day 4 after secondary immunization. Each clone was tested for antigen specificity in a proliferation assay (Fig. 4, and data not shown). The alignment is based on common use of the Vβ8 segment. Boxes separate germline sequences from N-region additions. Each TCR Dβ and Jβ assignment is displayed next to the corresponding sequence. The predicted amino acid sequence is displayed below each corresponding sequence. Sequences which contain the CDR3 amino acid composition (A/G)WDWx(x) (in bold) are listed as canonical; the other sequences are considered noncanonical. The numbers of clones displaying a particular clonotypic sequence as well as percentages of canonical and noncanonical sequences are listed. *No assignment to either a Dβ1 or a Dβ2 germline sequence could be made.
Figure 5
Figure 5
Correlation between tetramer staining and TCR affinity. (A) SWM 110–121–specific MHC–SWM tetramers constructed as described in reference 36 and Materials and Methods were used to stain representative SWM reactive T cell clones. The corrected mean fluorescence intensity was normalized to the level of staining with a biotinylated anti-Cβ mAb detected with PESA. The normalized staining was used to estimate the K D of each clone TCR from a previously constructed standard (references 28 and 42) curve relating staining intensity to known TCR K D (reference 28). (B) Correlation between estimated K D and ED50. The clones are the same as used for tetramer analysis in A.
Figure 4
Figure 4
Direct correlation between TCR function and ED50 values. (A) Inhibition of proliferation in response to 30 μM SWM 110–121 by titrated doses of anti-Vβ8 Ab. Inhibition curves for four representative T cell clones are shown. The mean ED50 value of each respective T cell clone is 3D3 (ED50 ≥ 50 μM), 3B5b (ED50 = 15 μM), 3E11 (ED50 = 0.6 μM), and 3E4 (ED50 = 0.07 μM). (B) Shown is the correlation between the ED50 values of nine T cell clones and the percentage of inhibition of proliferative response to 30 μM SWM 110–121 when 1.25 μg/ml anti-Vβ8 Ab was added to the culture. At ED50 = 1 μM and ED50 = 50 μM, three different T cell clones displaying identical ED50 were tested to determine the percentage of inhibition of proliferation. Each T cell clone was tested at least twice. Error bars represent the SEM.
Figure 4
Figure 4
Direct correlation between TCR function and ED50 values. (A) Inhibition of proliferation in response to 30 μM SWM 110–121 by titrated doses of anti-Vβ8 Ab. Inhibition curves for four representative T cell clones are shown. The mean ED50 value of each respective T cell clone is 3D3 (ED50 ≥ 50 μM), 3B5b (ED50 = 15 μM), 3E11 (ED50 = 0.6 μM), and 3E4 (ED50 = 0.07 μM). (B) Shown is the correlation between the ED50 values of nine T cell clones and the percentage of inhibition of proliferative response to 30 μM SWM 110–121 when 1.25 μg/ml anti-Vβ8 Ab was added to the culture. At ED50 = 1 μM and ED50 = 50 μM, three different T cell clones displaying identical ED50 were tested to determine the percentage of inhibition of proliferation. Each T cell clone was tested at least twice. Error bars represent the SEM.

References

    1. Kim D.T., Rothbard J.B., Bloom D.D., Fathman C.G. Quantitative analysis of T cell activationrole of TCR/ligand density and TCR affinity. J. Immunol. 1996;156:2737–2742. - PubMed
    1. Sloan-Lancaster J., Allen P.M. Altered peptide ligand-induced partial T cell activationmolecular mechanisms and role in T cell biology. Annu. Rev. Immunol. 1996;14:1–27. - PubMed
    1. Hampl J., Chien Y.H., Davis M.M. CD4 augments the response of a T cell to agonist but not to antagonist ligands. Immunity. 1997;7:379–385. - PubMed
    1. Kersh G.J., Allen P.M. Essential flexibility in the T-cell recognition of antigen. Nature. 1996;380:495–498. - PubMed
    1. Garcia K.C., Degano M., Pease L.R., Huang M., Peterson P.A., Teyton L., Wilson I.A. Structural basis of plasticity in T cell receptor recognition of a self peptide-MHC antigen. Science. 1998;279:1166–1172. - PubMed

Publication types

MeSH terms