. 2000 Dec 18;192(12):1849-56.
doi: 10.1084/jem.192.12.1849.

Delayed expulsion of the nematode Trichinella spiralis in mice lacking the mucosal mast cell-specific granule chymase, mouse mast cell protease-1

Affiliations

Delayed expulsion of the nematode Trichinella spiralis in mice lacking the mucosal mast cell-specific granule chymase, mouse mast cell protease-1

P A Knight et al. J Exp Med. .

Abstract

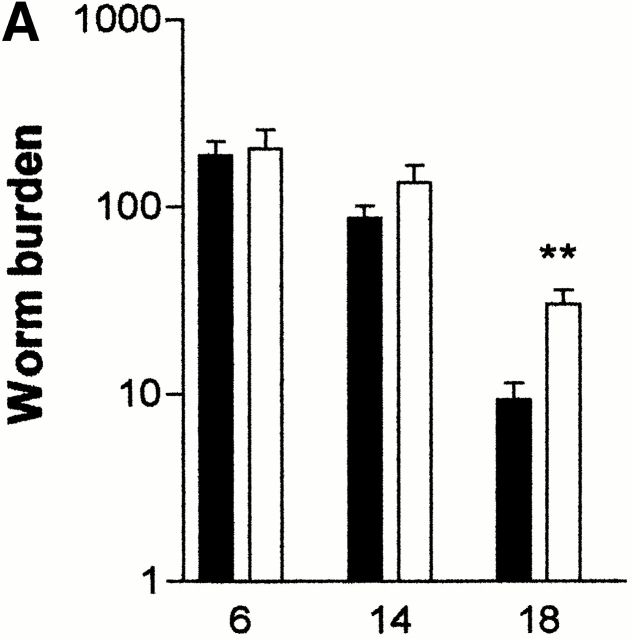
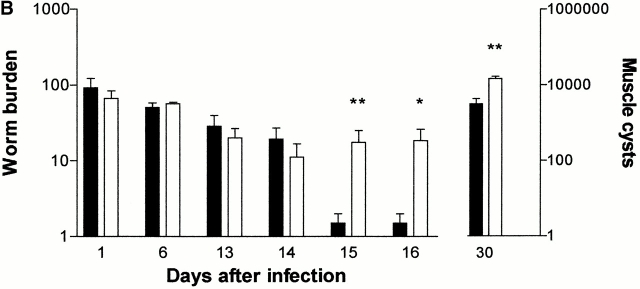
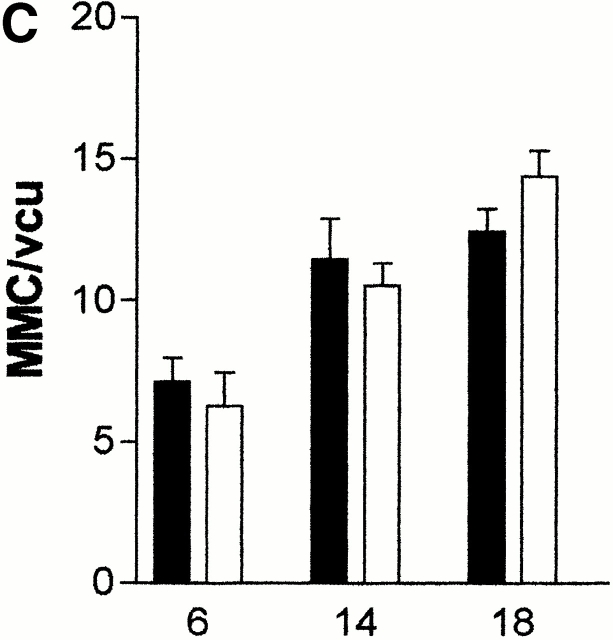
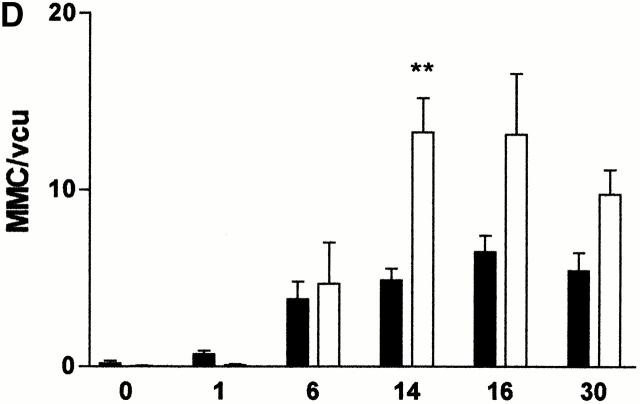
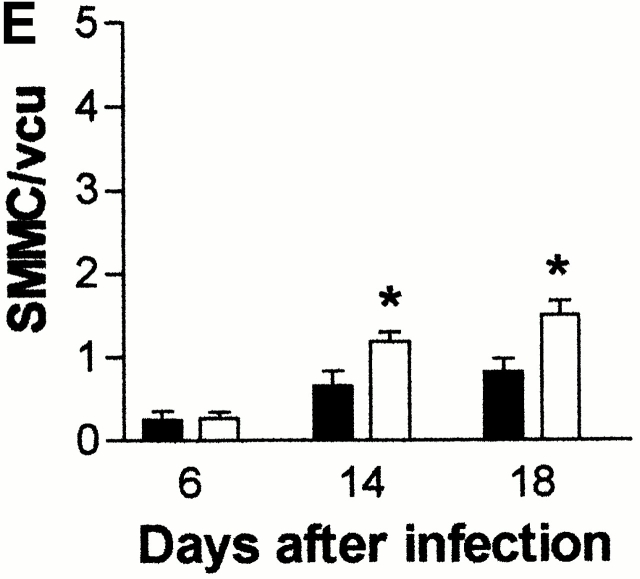
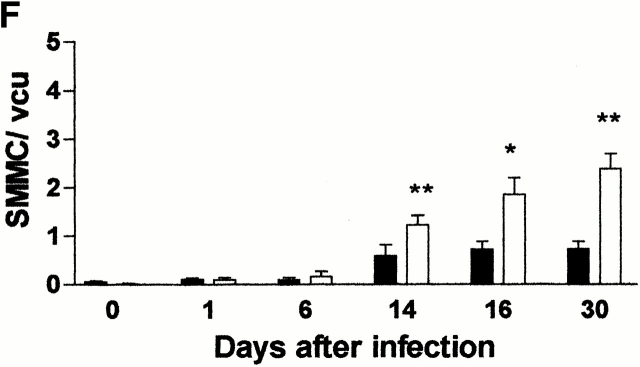
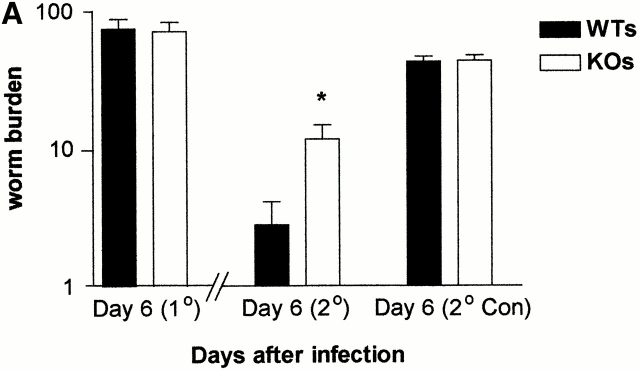
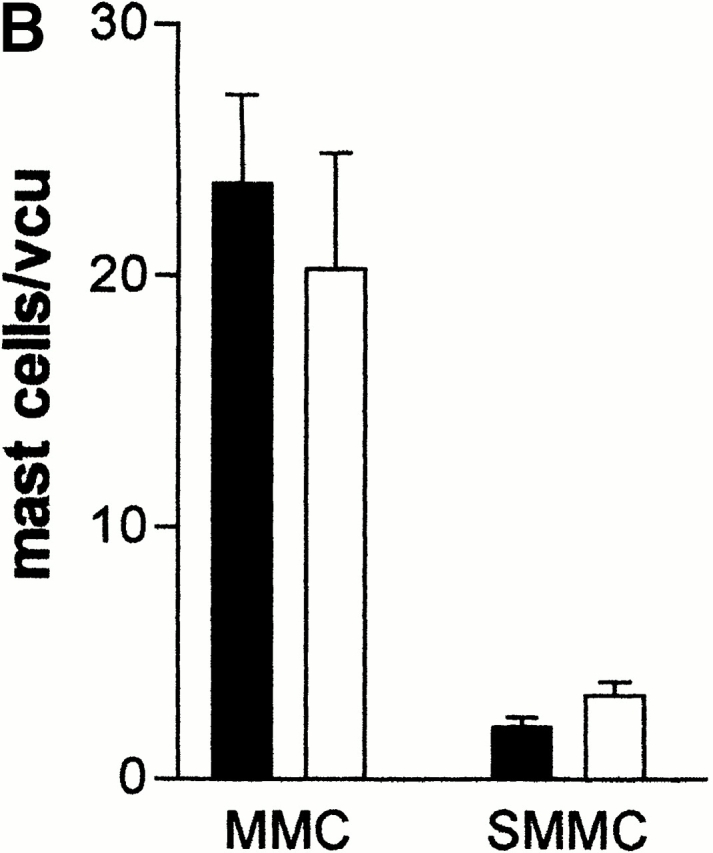
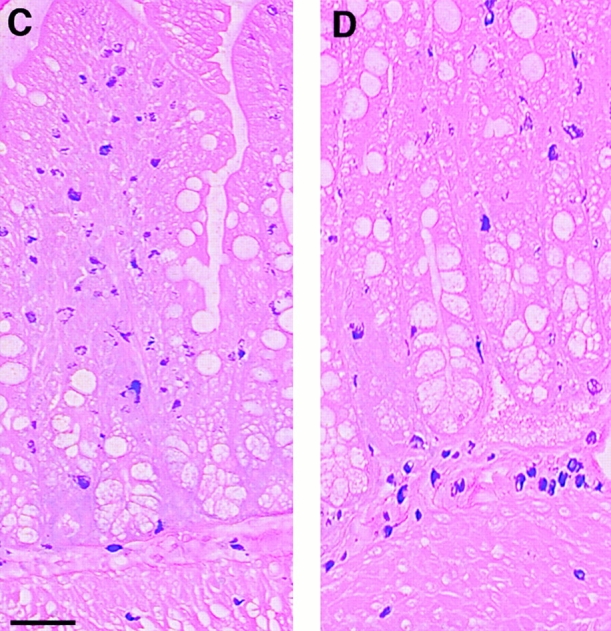
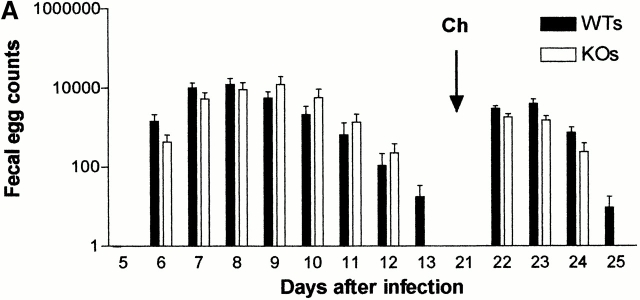
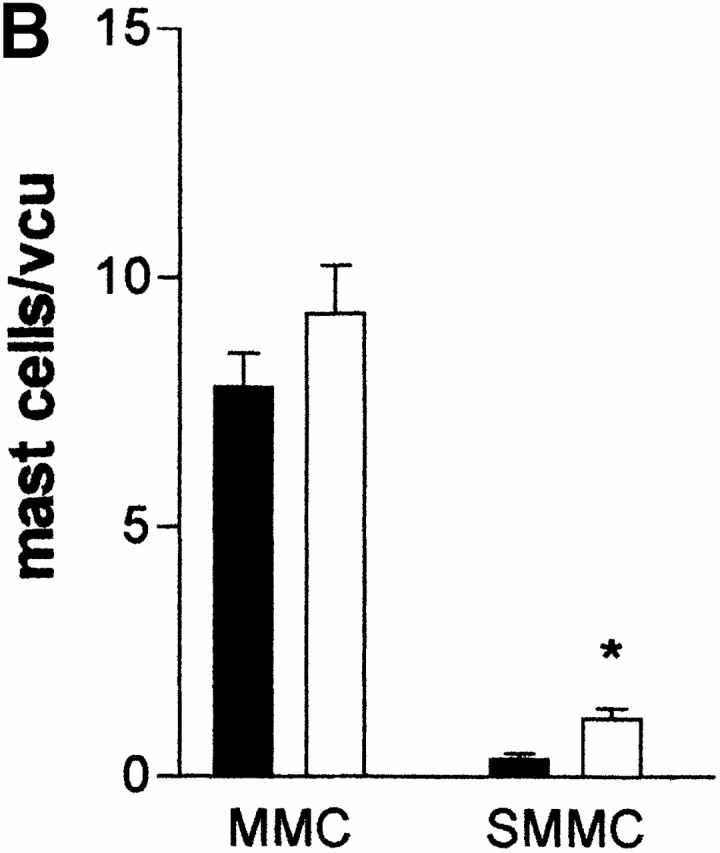
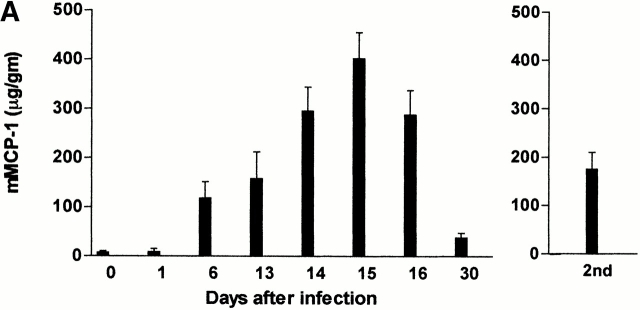
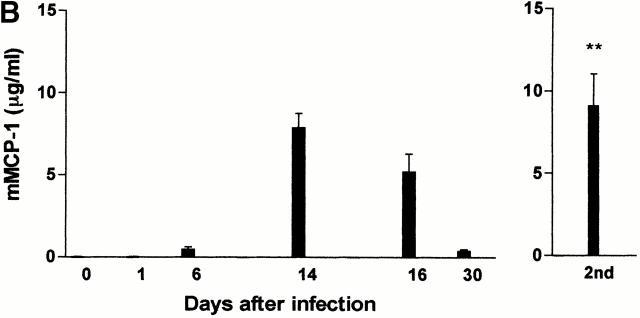
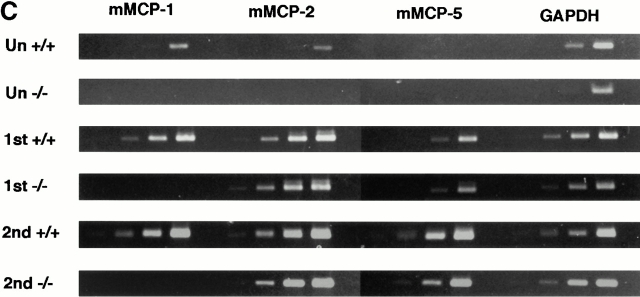
Expulsion of gastrointestinal nematodes is associated with pronounced mucosal mast cell (MMC) hyperplasia, differentiation, and activation, accompanied by the systemic release of MMC granule chymases (chymotrypsin-like serine proteases). The beta-chymase mouse mast cell protease-1 (mMCP-1) is expressed predominantly by intraepithelial MMCs, and levels in the bloodstream and intestinal lumen are maximal at the time of worm expulsion in parasitized mice. To address the in vivo functions of MMC-specific beta-chymases, we have generated transgenic mice that lack the mMCP-1 gene. They were backcrossed onto a congenic BALB/c background to investigate the response to nematode infection. The deletion of the mMCP-1 gene is associated with significantly delayed expulsion of Trichinella spiralis and increased deposition of muscle larvae in BALB/c mice despite the presence of normal and sometimes increased numbers of MMCs. Neither worm fecundity nor worm burdens were altered in Nippostrongylus-infected mMCP-1(-/)- BALB/c mice. These data demonstrate, for the first time, that the ablation of an MMC-derived effector molecule compromises the expulsion process.


Figures

Figure 1
Figure 1
(A) Mean total worm burdens (log10 [x + 1] + SE) from T. spiralis–infected mMCP-1+/+ (filled bars) and mMCP-1 −/− (open bars) BALB/c F7 mice. Representative of two experiments. (B) Mean total worm burdens (log10 [x + 1] + SE) and muscle larvae (day 30) (log10 [x + 1] + SE) from T. spiralis–infected mMCP-1+/+ and mMCP-1−/− BALB/c F10 mice. (C and E) Mast cell counts (+SE) in the jejunum from mMCP-1+/+ and mMCP-1−/− BALB/c F7 mice are shown 6, 14, and 18 d after primary infection with 500 T. spiralis muscle larvae per mouse (shown in A). The cells are counted per vcu in the epithelium and lamina propria (B; MMC/vcu) and in the submucosa (C; SMMC/vcu) underlying each vcu. (D and F) Mast cell counts (+SE) in the jejunum from mMCP-1+/+ and mMCP-1−/− BALB/c F10 mice 0–30 d after primary infection with 300 T. spiralis muscle larvae per mouse (shown in D).
Figure 1
Figure 1
(A) Mean total worm burdens (log10 [x + 1] + SE) from T. spiralis–infected mMCP-1+/+ (filled bars) and mMCP-1 −/− (open bars) BALB/c F7 mice. Representative of two experiments. (B) Mean total worm burdens (log10 [x + 1] + SE) and muscle larvae (day 30) (log10 [x + 1] + SE) from T. spiralis–infected mMCP-1+/+ and mMCP-1−/− BALB/c F10 mice. (C and E) Mast cell counts (+SE) in the jejunum from mMCP-1+/+ and mMCP-1−/− BALB/c F7 mice are shown 6, 14, and 18 d after primary infection with 500 T. spiralis muscle larvae per mouse (shown in A). The cells are counted per vcu in the epithelium and lamina propria (B; MMC/vcu) and in the submucosa (C; SMMC/vcu) underlying each vcu. (D and F) Mast cell counts (+SE) in the jejunum from mMCP-1+/+ and mMCP-1−/− BALB/c F10 mice 0–30 d after primary infection with 300 T. spiralis muscle larvae per mouse (shown in D).
Figure 2
Figure 2
(A) Mean worm burdens (log10 [x + 1] + SE) in mMCP-1+/+ and mMCP-1−/− BALB/c F10 mice after primary infection on day 0 (1°) and challenge infection on day 21 (2°) with 300 T. spiralis muscle larvae per mouse. Data are shown 6 d after an initial primary infection (day 6 [1°]), 6 d after receiving the challenge dose (day 6 [2°]), and from an equivalent naive group that received the challenge dose only (day 6 [2° Con]). (B). Mast cell counts (+SE) in the jejunum from mMCP-1+/+ (WTs) and mMCP-1−/− (KOs) BALB/c F10 mice are shown 6 d after challenge infection with T. spiralis (shown in A). See legend for Fig. 1c and Fig. e. (C and D) Toluidine blue/eosin-stained jejunum from mMCP-1+/+ (C) and mMCP-1−/− (D) BALB/c F10 mice 6 d after challenge with T. spiralis. The reduced intensity of staining of MMCs in the villi in mMCP-1−/− jejunum is in accordance with previous data 11. Note the abundant mast cells in the submucosa of the mMCP-1−/− jejunum compared with that of mMCP-1+/+ jejunum.
Figure 2
Figure 2
(A) Mean worm burdens (log10 [x + 1] + SE) in mMCP-1+/+ and mMCP-1−/− BALB/c F10 mice after primary infection on day 0 (1°) and challenge infection on day 21 (2°) with 300 T. spiralis muscle larvae per mouse. Data are shown 6 d after an initial primary infection (day 6 [1°]), 6 d after receiving the challenge dose (day 6 [2°]), and from an equivalent naive group that received the challenge dose only (day 6 [2° Con]). (B). Mast cell counts (+SE) in the jejunum from mMCP-1+/+ (WTs) and mMCP-1−/− (KOs) BALB/c F10 mice are shown 6 d after challenge infection with T. spiralis (shown in A). See legend for Fig. 1c and Fig. e. (C and D) Toluidine blue/eosin-stained jejunum from mMCP-1+/+ (C) and mMCP-1−/− (D) BALB/c F10 mice 6 d after challenge with T. spiralis. The reduced intensity of staining of MMCs in the villi in mMCP-1−/− jejunum is in accordance with previous data 11. Note the abundant mast cells in the submucosa of the mMCP-1−/− jejunum compared with that of mMCP-1+/+ jejunum.
Figure 3
Figure 3
(A) Mean fecal egg counts (log10 [x + 1] + SE) from mMCP-1+/+ (WTs) and mMCP-1−/− (KOs) BALB/c F10 mice after receiving a primary infection on day 0 with 500 N. brasiliensis larvae and challenge infection by gavage with 200 adult worms on day 21. (B) Mast cell counts (+SE) in the jejunum from mMCP-1+/+ (WTs) and mMCP-1−/− (KOs) BALB/c F10 mice 3 d after challenge infection with adult N. brasiliensis. See legend for Fig. 1c and Fig. e.
Figure 3
Figure 3
(A) Mean fecal egg counts (log10 [x + 1] + SE) from mMCP-1+/+ (WTs) and mMCP-1−/− (KOs) BALB/c F10 mice after receiving a primary infection on day 0 with 500 N. brasiliensis larvae and challenge infection by gavage with 200 adult worms on day 21. (B) Mast cell counts (+SE) in the jejunum from mMCP-1+/+ (WTs) and mMCP-1−/− (KOs) BALB/c F10 mice 3 d after challenge infection with adult N. brasiliensis. See legend for Fig. 1c and Fig. e.
Figure 4
Figure 4
(A and B) Concentrations of mMCP-1 in the jejunum (A) (microgram per gram wet weight) and serum (B) (microgram per milliliter) from mMCP-1+/+ and mMCP-1−/− mice 0–30 d after infection with T. spiralis (shown in Fig. 1 B) and 6 d after challenge (2nd) (Fig. 2 A), as assessed by mMCP-1–specific ELISA. Note that mMCP-1 was undetectable in the mMCP-1−/− mice. (C) Transcription of chymase genes mMCP-1, -2, and -5 and the housekeeping gene GAPDH in total jejunal RNA from T. spiralis infected mMCP-1+/+ and mMCP-1−/− BALB/c F10 mice. Total RNA was extracted from uninfected jejunum (Un) and from jejunum 6 d after primary (1st) and challenge (2nd) infection with T. spiralis. For each primer set, tracks are loaded with reverse transcription PCR products from PCR reactions stopped after 16, 20, 24, and 28 thermocycles, plus a negative control (equivalent quantities of non–reverse-transcribed RNA amplified for 28 thermocycles), respectively.
Figure 4
Figure 4
(A and B) Concentrations of mMCP-1 in the jejunum (A) (microgram per gram wet weight) and serum (B) (microgram per milliliter) from mMCP-1+/+ and mMCP-1−/− mice 0–30 d after infection with T. spiralis (shown in Fig. 1 B) and 6 d after challenge (2nd) (Fig. 2 A), as assessed by mMCP-1–specific ELISA. Note that mMCP-1 was undetectable in the mMCP-1−/− mice. (C) Transcription of chymase genes mMCP-1, -2, and -5 and the housekeeping gene GAPDH in total jejunal RNA from T. spiralis infected mMCP-1+/+ and mMCP-1−/− BALB/c F10 mice. Total RNA was extracted from uninfected jejunum (Un) and from jejunum 6 d after primary (1st) and challenge (2nd) infection with T. spiralis. For each primer set, tracks are loaded with reverse transcription PCR products from PCR reactions stopped after 16, 20, 24, and 28 thermocycles, plus a negative control (equivalent quantities of non–reverse-transcribed RNA amplified for 28 thermocycles), respectively.

References

    1. Enerback L. Mucosal mast cells in the rat and man. Int. Arch. Allergy Appl. Immunol. 1987;82:249–253. - PubMed
    1. Befus A.D., Pearce F.L., Gauldie J., Horsewood P., Bienstock J. Mucosal mast cells 1. Isolation and functional characteristics of rat intestinal mast cells. J. Immunol. 1982;128:2475–2480. - PubMed
    1. Miller H.R.P., Huntley J.F., Newlands G.F.J., Mackellar A., Lammas D.A., Wakelin D. Granule proteases define mast cell heterogeneity in the serosa and gastrointestinal mucosa of the mouse. Immunology. 1988;65:559–566. - PMC - PubMed
    1. Stevens R.L., Friend D.S., McNeil H.P., Schiller V., Ghildyal N., Austen K.F. Strain-specific and tissue specific expression of mouse mast cell secretory granule proteases. Proc. Natl. Acad. Sci. USA. 1994;91:128–132. - PMC - PubMed
    1. Woodbury R.G., Miller H.R.P., Huntley J.F., Newlands G.F.J., Palliser A.C., Wakelin D. Mucosal mast cells are functionally active during spontaneous expulsion of intestinal nematode infections in the rat. Nature. 1984;312:450–452. - PubMed

Publication types

MeSH terms