. 2001 Jan;45(1):129-37.
doi: 10.1128/AAC.45.1.129-137.2001.

Validation of a noninvasive, real-time imaging technology using bioluminescent Escherichia coli in the neutropenic mouse thigh model of infection

Affiliations

Validation of a noninvasive, real-time imaging technology using bioluminescent Escherichia coli in the neutropenic mouse thigh model of infection

H L Rocchetta et al. Antimicrob Agents Chemother. 2001 Jan.

Abstract

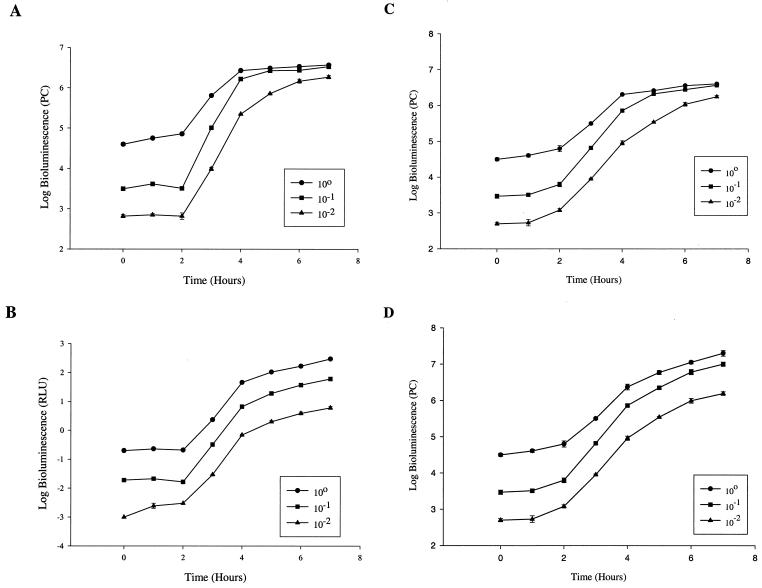
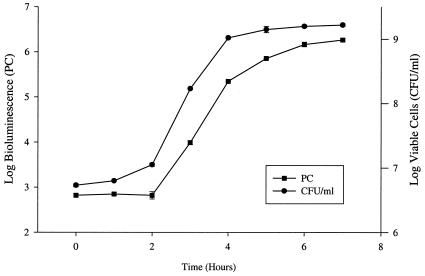
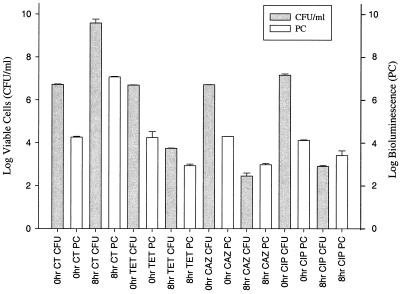
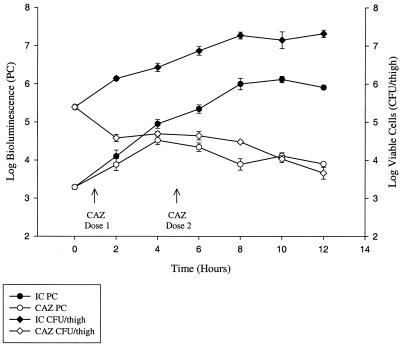
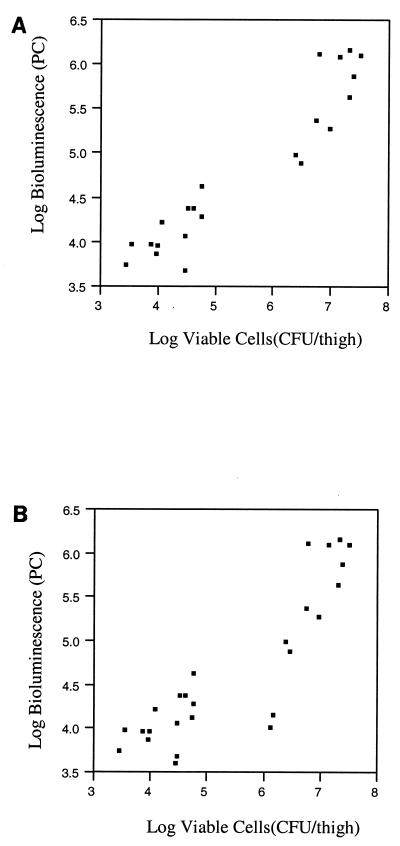
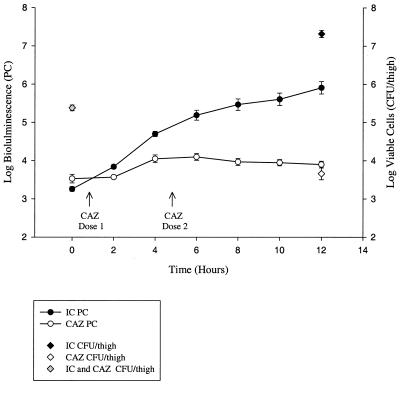
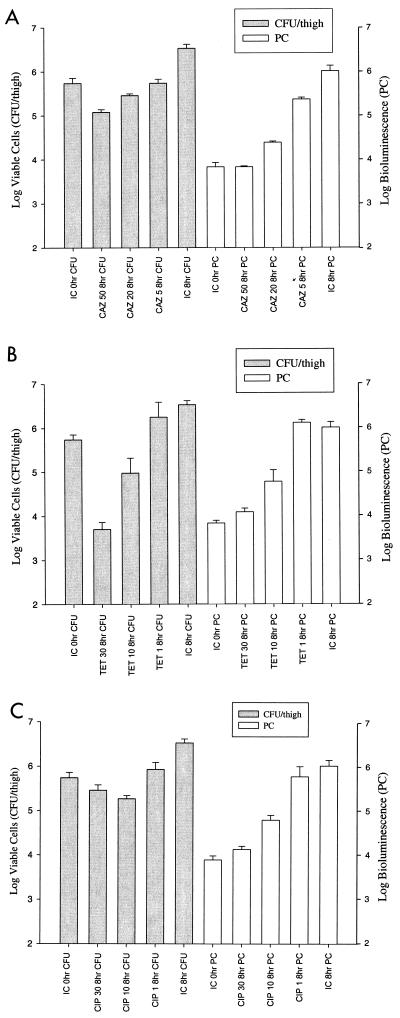
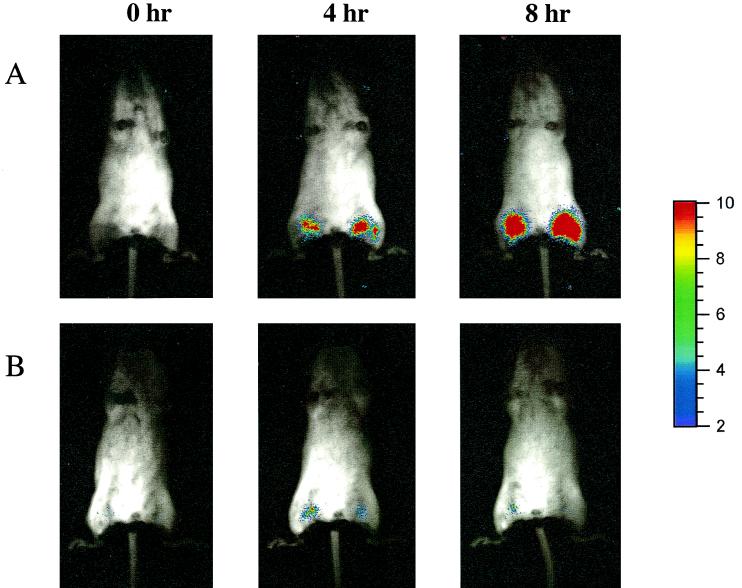
A noninvasive, real-time detection technology was validated for qualitative and quantitative antimicrobial treatment applications. The lux gene cluster of Photorhabdus luminescens was introduced into an Escherichia coli clinical isolate, EC14, on a multicopy plasmid. This bioluminescent reporter bacterium was used to study antimicrobial effects in vitro and in vivo, using the neutropenic-mouse thigh model of infection. Bioluminescence was monitored and measured in vitro and in vivo with an intensified charge-coupled device (ICCD) camera system, and these results were compared to viable-cell determinations made using conventional plate counting methods. Statistical analysis demonstrated that in the presence or absence of antimicrobial agents (ceftazidime, tetracycline, or ciprofloxacin), a strong correlation existed between bioluminescence levels and viable cell counts in vitro and in vivo. Evaluation of antimicrobial agents in vivo could be reliably performed with either method, as each was a sound indicator of therapeutic success. Dose-dependent responses could also be detected in the neutropenic-mouse thigh model by using either bioluminescence or viable-cell counts as a marker. In addition, the ICCD technology was examined for the benefits of repeatedly monitoring the same animal during treatment studies. The ability to repeatedly measure the same animals reduced variability within the treatment experiments and allowed equal or greater confidence in determining treatment efficacy. This technology could reduce the number of animals used during such studies and has applications for the evaluation of test compounds during drug discovery.


Figures

FIG. 1
FIG. 1
Bioluminescence growth curves of EC14(pCGLS1.UC) grown in vitro. A series of 10-fold dilutions were measured for bioluminescence using the ICCD camera (A) and the microtiter luminometer (B) from 0 to 7 h. Bioluminescence is reported as PCs for the ICCD camera and relative light units (RLU) for the luminometer. Panels C and D compare bioluminescence reading of the ICCD camera in the presence (D) and absence (C) of lens filters. For panel D, only those bioluminescence readings greater than 6 log units were measured using the lens filters. The values are means plus or minus standard errors (SE) of two independent experiments.
FIG. 2
FIG. 2
Growth and bioluminescence curves (10−2 dilution) of EC14(pCGLS1.UC). Viable counts are represented as CFU/ml, while bioluminescence, measured with the ICCD camera, is expressed as PCs. The correlation of viable-cell count to bioluminescence was 0.98. Each set of measurements is the mean of two independent experiments ± SE.
FIG. 3
FIG. 3
Viable-cell counts and bioluminescence (ICCD) measurements of EC14(pCGLS1.UC) grown in vitro and treated with either tetracycline (TET), ceftazidime (CAZ), or ciprofloxacin (CIP). The cultures were treated with the antibiotics at mid-log phase, using 250-fold the MIC. Viable-cell counts and bioluminescence were measured at 0 and 8 h. The correlation of viable-cell count to bioluminescence was 0.98. Each set of measurements is the mean of two separate experiments ± SE. CT, untreated control.
FIG. 4
FIG. 4
Growth and bioluminescence curves of EC14(pCGLS1.UC) grown in vivo using the neutropenic-mouse thigh model of infection. Viable counts are reported as CFU per thigh, and bioluminescence is represented as PCs as measured using the ICCD camera. Each data point is the mean ± SE determined using two animals, with the exception of the 12-h time point, which is the mean ± SE of four animals. Bioluminescence was determined at each time point from a set of two or four animals immediately prior to determination of viable-cell count. In this study, the correlation of viable-cell count to bioluminescence was 0.95 from 4 to 12 h and 0.88 from 2 to 12 h. IC, infection control; CAZ, ceftazidime treatment (50 mg/kg at 1 and 5 h postinfection).
FIG. 5
FIG. 5
Scatterplots of viable cells and bioluminescence data used to generate the graph and correlations from Fig. 4. (A) The correlation plot for the in vivo study between 4 and 12 h (correlation coefficient, 0.95); (B) the plot for data between 2 and 12 h (correlation coefficient, 0.88). Both plots demonstrate the linear relationship between bioluminescence and viable-cell counts. Separate clustering of the treated and untreated animals can also be seen in the lower and upper quadrants of the plots.
FIG. 6
FIG. 6
In vivo bioluminescence monitoring of EC14(pCGLS1.UC) in the neutropenic-mouse thigh model of infection using the ICCD camera. Each data point is the mean ± SE of the same four animals at each time point. Viable counts are indicated for 0- and 12-h time points for both the untreated infection control group and the ceftazidime treated group. IC, infection control; CAZ, ceftazidime treatment (50 mg/kg at 1 and 5 h postinfection).
FIG. 7
FIG. 7
Comparison of viable counts and bioluminescence (measured by ICCD camera) with administration of different doses of ceftazidime (CAZ; 50, 20, and 5 mg/kg) (A), tetracycline (TET; 30, 10, and 1 mg/kg) (B), and ciprofloxacin (CIP; 30, 10, and 1 mg/kg) (C) in the neutropenic-mouse thigh model of infection. Viable counts and bioluminescence were determined at 0 and 8 h for each dose of antibiotic and for infection controls (IC). The correlation between viable- cell count and bioluminescence is 0.98, 0.94, and 0.91 for ceftazidime (A), tetracycline (B), and ciprofloxacin (C), respectively. Each data set is the mean ± SE determined using two animals.
FIG. 8
FIG. 8
Localization of EC14(pCGLS1.UC) in the neutropenic-mouse thigh model. A bacterial suspension of 105 cells/thigh was injected intramuscularly, and images were acquired with the ICCD camera at 0, 4, and 8 h. Infection control animals are shown in panel A, while panel B illustrates the antibacterial effects of a 50-mg/kg treatment with ceftazidime administered IP at 1 and 5 h postinfection. A similar bit range of 0 to 3 was used to display each image.

References

    1. Arain T M, Resconi A E, Hickey M J, Stover C K. Bioluminescence screening in vitro (Bio-Siv) assays for high-volume antimycobacterial drug discovery. Antimicrob Agents Chemother. 1996;40:1536–1541. - PMC - PubMed
    1. Binotto J, MacLachlan R, Sanderson K E. Electrotransformation in Salmonella typhimurium LT2. Can J Microbiol. 1991;37:474–477. - PubMed
    1. Camilli A. Noninvasive techniques for studying pathogenic bacteria in the whole animal. Trends Microbiol. 1996;4:295–296. - PubMed
    1. Casey W M, Nguyen N A. Use of the green fluorescent protein to rapidly assess viability of E. coli in preserved solutions. J Pharm Sci Technol. 1996;50:352–355. - PubMed
    1. Cleeland R, Squires E. Evaluation of new antimicrobials in vitro and in experimental animal infections. In: Lorian V, editor. Antibiotics in laboratory medicine. 3rd ed. New York, N.Y: The Williams & Wilkins Co.; 1991. pp. 739–786.

Publication types

MeSH terms