. 2000 Dec 19;97(26):14085-90.
doi: 10.1073/pnas.97.26.14085.

Identifying mRNA subsets in messenger ribonucleoprotein complexes by using cDNA arrays

Affiliations

Identifying mRNA subsets in messenger ribonucleoprotein complexes by using cDNA arrays

S A Tenenbaum et al. Proc Natl Acad Sci U S A. .

Abstract

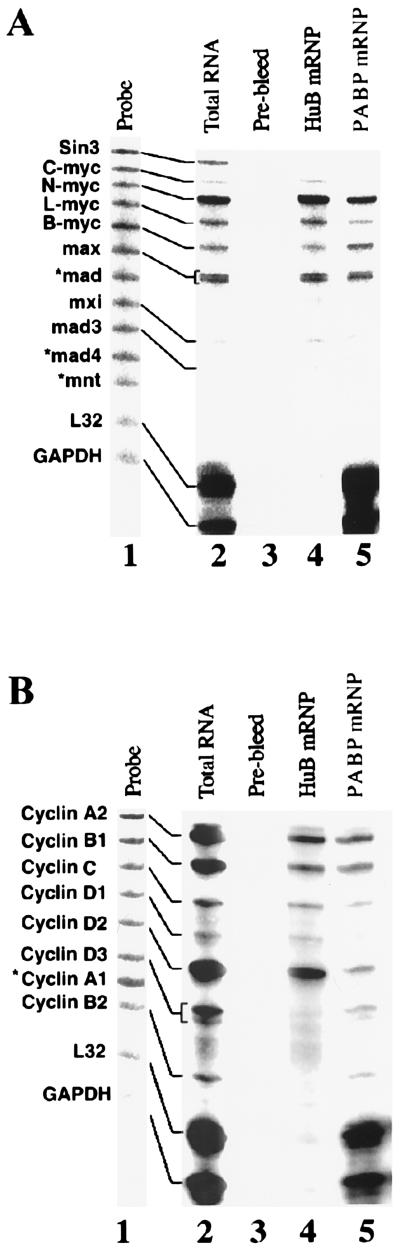
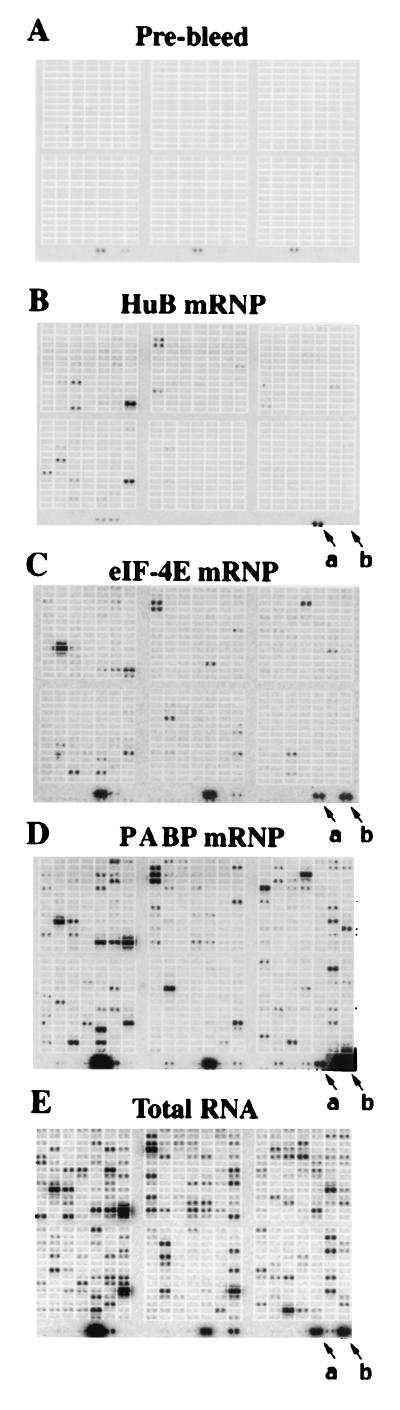
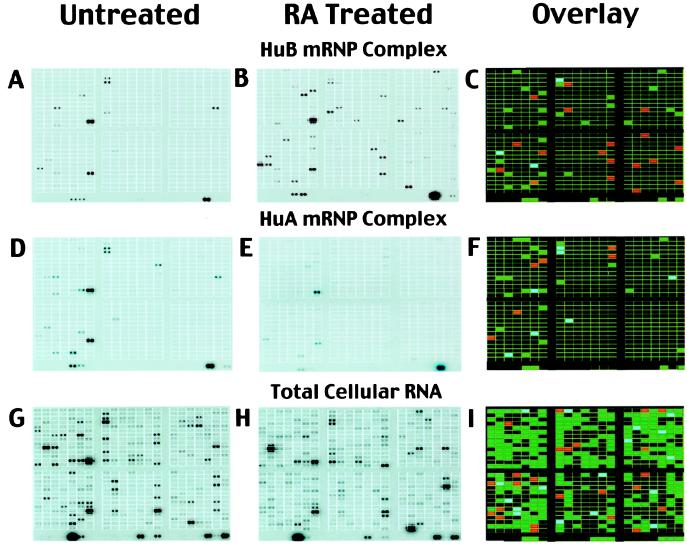
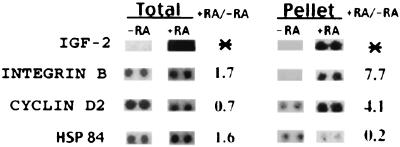
Genomic array technologies provide a means for profiling global changes in gene expression under a variety of conditions. However, it has been difficult to assess whether transcriptional or posttranscriptional regulation is responsible for these changes. Additionally, fluctuations in gene expression in a single cell type within a complex tissue like a tumor may be masked by overlapping profiles of all cell types in the population. In this paper, we describe the use of cDNA arrays to identify subsets of mRNAs contained in endogenous messenger ribonucleoprotein complexes (mRNPs) that are cell type specific. We identified mRNA subsets from P19 embryonal carcinoma stem cells by using mRNA-binding proteins HuB, eIF-4E, and PABP that are known to play a role in translation. The mRNA profiles associated with each of these mRNPs were unique and represented gene clusters that differed from total cellular RNA. Additionally, the composition of mRNAs detected in HuB-mRNP complexes changed dramatically after induction of neuronal differentiation with retinoic acid. We suggest that the association of structurally related mRNAs into mRNP complexes is dynamic and may help regulate posttranscriptional events such as mRNA turnover and translation. Recovering proteins specifically associated with mRNP complexes to identify and profile endogenously clustered mRNAs should provide insight into structural and functional relationships among gene transcripts and/or their protein products. We have termed this approach to functional genomics ribonomics and suggest that it will provide a useful paradigm for organizing genomic information in a biologically relevant manner.


Figures

Figure 1
Figure 1
Multiprobe RNase protection analysis of mRNAs associated with mRNP complexes. mRNP complexes from P19 cell lysates were immunoprecipitated and the pelleted RNA extracted and quantitated by RNase protection as described in Materials and Methods by using the PharMingen Riboquant assay. (A) mMyc MultiProbe template set; (B) mCyc-1 MultiProbe template set. Lanes: 1, undigested riboprobe (slightly larger than RNase digested product because of riboprobe plasmid template); 2, total cellular RNA; 3, rabbit prebleed serum control; 4, mRNAs extracted from HuB mRNPs; 5, mRNAs extracted from PABP mRNPs. *, mRNA species not detected in total RNA.
Figure 2
Figure 2
Profiles of mRNAs associated with mRNP complexes by using cDNA arrays. As described in Materials and Methods, RNA was extracted from immunoprecipitated mRNPs or total cell lysates and used to make reverse-transcribed probes for Atlas Mouse Arrays containing 597 double-spotted cDNA segments (CLONTECH). (A) Prebleed; (B) HuB–mRNP complexes; (C) eIF-4E–mRNP complexes; (D) PABP–mRNP complexes; (E) total cellular RNA. An example of the quality of enrichment between mRNA profiles is demonstrated in the relative abundance of β-actin and ribosomal protein S29 mRNAs (Fig. 2, arrows a and b, respectively).
Figure 3
Figure 3
Comparison of the mRNA profiles from HuB mRNPs before and after treatment with RA. As described in Materials and Methods, phosphorimages were scanned and stored as gel files and then analyzed by using atlasimage 1.01 software (CLONTECH). A default external background setting was used in conjunction with a background-based signal threshold to determine gene signal significance. Comparisons of multiple cDNA array images were performed by using an average of all of the gene signals on the array (global normalization) to normalize the signal intensity between arrays. Changes in the mRNA profile of HuB–mRNP complexes in response to RA treatment were considered significant if they were 4-fold or greater. (A) Untreated p19 HuB mRNPs; (B) RA-treated p19 HuB mRNPs; (C) comparison of A and B; (D) untreated p19 HuA (HuR) mRNPs; (E) RA-treated p19 HuA mRNPs; (F) comparison of D and E; (G) untreated p19 total RNA; (H) RA-treated p19 total RNA; (I) comparison of G and H. Red bars represent mRNAs that increased 4-fold or greater after RA treatment, and blue bars represent mRNAs that decreased 4-fold or greater. Green bars indicate mRNAs of approximately equal abundance.
Figure 4
Figure 4
Comparison of ribonomic profiling with global gene profiling. Selected examples of mRNAs that demonstrate differences between the total RNA profile in comparison with HuB-bound mRNAs before and after RA treatment. *, mRNAs detected only in RA-treated cells.

References

    1. Gygi S P, Rochon Y, Franza B R, Aebersold R. Mol Cell Biol. 1999;19:1720–1730. - PMC - PubMed
    1. Futcher B, Latter G I, Monardo P, McLaughlin C S, Garrels J I. Mol Cell Biol. 1999;19:7357–7368. - PMC - PubMed
    1. Richter J D. In: Translational Control. Hershey J W B, Mathews M B, Sonenberg N, editors. Plainview, NY: Cold Spring Harbor Lab. Press; 1996. pp. 481–504.
    1. Jacobson A, Peltz S W. Annu Rev Biochem. 1996;65:693–739. - PubMed
    1. Wickens M, Anderson P, Jackson R J. Curr Opin Genet Dev. 1997;7:220–232. - PubMed

Publication types

LinkOut - more resources