. 2000 Dec 19;97(26):14488-93.
doi: 10.1073/pnas.97.26.14488.

Haploinsufficiency of steroidogenic factor-1 in mice disrupts adrenal development leading to an impaired stress response

Affiliations

Haploinsufficiency of steroidogenic factor-1 in mice disrupts adrenal development leading to an impaired stress response

M L Bland et al. Proc Natl Acad Sci U S A. .

Abstract

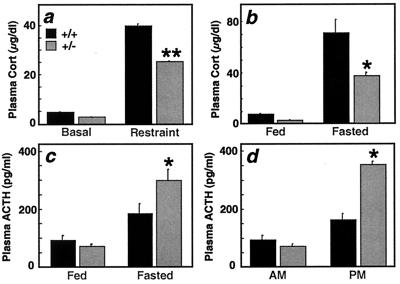
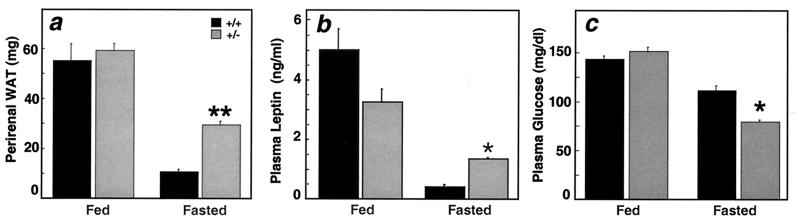
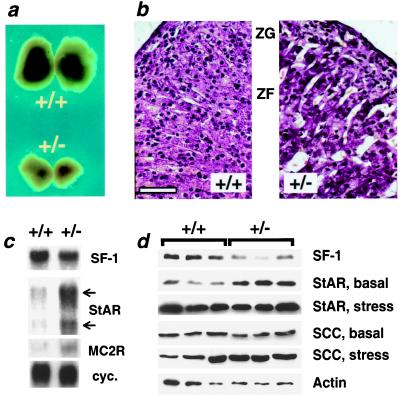
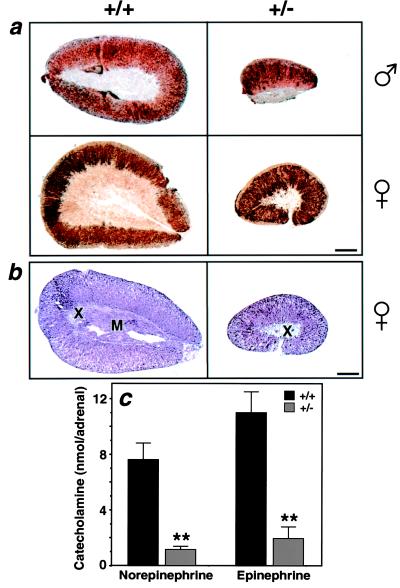
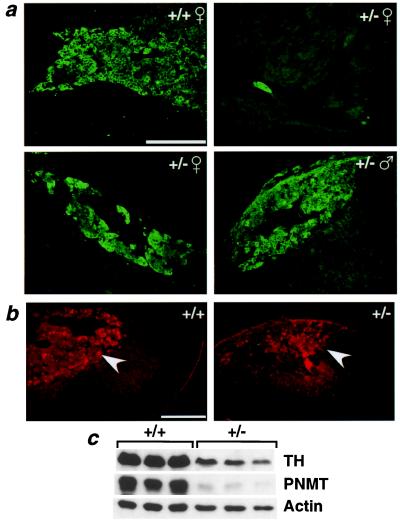
Adrenal steroids are essential for homeostasis and survival during severe physiological stress. Analysis of a patient heterozygous for the steroidogenic factor-1 (SF-1) gene suggested that reduced expression of this nuclear receptor leads to adrenal failure. We therefore examined SF-1 heterozygous (+/-) mice as a potential model for delineating mechanisms underlying this disease. Here we show that SF-1 +/- mice exhibit adrenal insufficiency resulting from profound defects in adrenal development and organization. However, compensatory mechanisms, such as cellular hypertrophy and increased expression of the rate-limiting steroidogenic protein StAR, help to maintain adrenal function at near normal capacity under basal conditions. In contrast, adrenal deficits in SF-1 heterozygotes are revealed under stressful conditions, demonstrating that normal gene dosage of SF-1 is required for mounting an adequate stress response. Our findings predict that natural variations leading to reduced SF-1 function may underlie some forms of subclinical adrenal insufficiency, which become life threatening during traumatic stress.


Figures

Figure 1
Figure 1
Impaired stress response and altered circadian hormone secretion in SF-1 +/− mice. (a) Plasma corticosterone (Cort) levels in SF-1 +/+ and +/− mice after 1 min (basal) and 30 min (restraint) of restraint stress (n = 11 or 12 per group). (b and c) Plasma corticosterone (b) and ACTH (c) levels in fed and fasted SF-1 +/+ and +/− mice (n = 4 per group). (d) Plasma ACTH levels in SF-1 +/+ and +/− mice at 8 a.m. (n = 4 per group) and 5 p.m. (n = 8 per group). Plasma corticosterone levels tended to be decreased in SF-1 +/− mice at 8 a.m. (+/+, 4.8 ± 0.4 μg/dl; +/−, 2.8 ± 0.2 μg/dl; n = 11 or 12 per group, P = 0.085) and at 5 p.m. (+/+, 11.5 ± 1.0 μg/dl; +/−, 6.8 ± 0.4 μg/dl; n = 8 per group, P = 0.075), although these results fall short of statistical significance. *, P ≤ 0.05 vs. wild type; **, P ≤ 0.01 vs. wild type.
Figure 2
Figure 2
Physiological consequences of decreased corticosterone secretion in fasted SF-1 +/− mice. (a) Perirenal white adipose tissue (WAT) weight in fed and fasted SF-1 +/+ and +/− mice. Similar results were obtained for subcutaneous WAT (data not shown). (b) Plasma leptin levels reflected fat mass in SF-1 +/+ and +/− mice. (c) Plasma glucose levels in fed and fasted SF-1 +/+ and +/− mice. For all panels, n = 4 per group. Plasma insulin levels were significantly decreased in fasted mice compared with fed mice, but did not differ between genotype (data not shown). *, P ≤ 0.05 vs. wild type; **, P ≤ 0.01 vs. wild type.
Figure 3
Figure 3
Glucocorticoid-induced thymocyte cell death is absent in SF-1 +/− mice. FACS analysis of thymocytes from fed (a) and fasted (b) SF-1 +/+ and +/− mice using CD4-PE and CD8-FITC (n = 4 mice per group). A FACS analysis from one mouse of each group is shown with the percentage of CD4+CD8+ cells per total cells analyzed shown in the upper right corner of each graph. Data shown for the +/+ fasted mouse reflects the strongest response. The average number of CD4+CD8+ cells per total cells analyzed did not differ between fed SF-1 +/+ and +/− mice (+/+, 68.6 ± 2.0%; +/−, 71.3 ± 1.6%), but was significantly different between fasted groups (+/+, 33.1 ± 3.6%; +/−, 61.6 ± 2.0%; P = 0.013).
Figure 4
Figure 4
Altered histology and gene expression in SF-1 +/− adrenal cortex. (a) Adult SF-1 +/+ adrenals are significantly larger than +/− adrenals (total adrenal weight for males: +/+, 3.3 ± 0.06 mg; +/−, 1.4 ± 0.02 mg; P < 0.01, n = 8 per group; females: +/+, 6.5 ± 0.06 mg; +/−, 2.3 ± 0.08 mg; P < 0.01, n = 7 per group). Body weight is equivalent in SF-1 +/+ and +/− mice (data not shown). Adrenal cross-sectional area is 2–3 times smaller in SF-1 +/− embryos compared with +/+ embryos at both E15.5 (+/+, 0.148 ± 0.001 mm2; +/−, 0.043 ± 0.001 mm2; P ≤ 0.01) and E18.5 (+/+, 0.216 ± 0.004 mm2; +/−, 0.090 ± 0.001 mm2; P ≤ 0.01). (b) Histological analysis of SF-1 +/+ and +/− adrenals. SF-1 +/− adrenals display cortical cell hypertrophy (cells per 0.01 mm2: +/+, 90.1 ± 0.9; +/−, 66.1 ± 0.7; P ≤ 0.01), dilated adrenocortical sinusoids, and a hypoplastic zona fasciculata (ZF) adjacent to the zona glomerulosa (ZG). Bar = 50 μM. (c) Northern blot analyses of SF-1, StAR, and MC2-R mRNA expression in SF-1 +/+ and +/− adrenals. Whereas SF-1 +/− adrenals express lower levels of SF-1 mRNA, they express higher levels of both the 3.4- and 1.6-kb StAR transcripts and the 1.7-kb MC2-R transcript. Cyclophilin mRNA levels (cyc.) are shown for loading comparison. (d) Western blot analyses of SF-1, StAR, SCC, and actin protein expression in adrenals from basal (fed) or stressed (fasted) SF-1 +/+ and +/− mice.
Figure 5
Figure 5
Altered adrenal medulla structure and function in SF-1 +/− mice. (a) Oil red O staining of male and female SF-1 +/+ and +/− adrenals reveals decreased adrenal cortex and medulla size in +/− adrenals. An eccentric medulla (unstained) is observed in male +/− adrenals, whereas a small central medulla with few chromaffin cells is observed in female +/− adrenals. Bar = 250 μM. (b) Histological analysis reveals an X zone (X) interior to the cortex and surrounding the medulla (M) in female +/+ adrenals. In female +/− adrenals, the central portion of the gland is composed largely of the X zone, with few medullary cells. Bar = 250 μM. (c) Male SF-1 +/+ and +/− adrenal norepinephrine and epinephrine content (n = 6 adrenals per group). The contribution of epinephrine to total adrenal catecholamine content was similar in SF-1 +/+ and +/− mice (60% vs. 55%). **, P ≤ 0.01 vs. wild type.
Figure 6
Figure 6
Altered histology and gene expression in SF-1 +/− adrenal medulla. (a) TH-immunoreactivity in female and male SF-1 +/+ and +/− adrenal medullae. Two examples of female +/− adrenals are included to demonstrate the extremes of phenotypic variability observed in female +/− medulla size. Bar = 250 μM. (b) Both SF-1 +/+ and +/− adrenals express PNMT. Arrowheads point to PNMT immunoreactivity in the adrenal medulla. Bar = 250 μM. (c) Western blot analyses of TH, PNMT, and actin protein expression in SF-1 +/+ and +/− adrenals.

References

    1. Oelkers W. N Engl J Med. 1996;335:1206–1212. - PubMed
    1. Orth D, Kovacs W. In: Williams Textbook of Endocrinology. Wilson J D, Foster D W, editors. Philadelphia: Saunders; 1992. pp. 853–951.
    1. Zanaria E, Muscatelli F, Bardoni B, Strom T M, Guioli S, Guo W, Lalli E, Moser C, Walker A P, McCabe E R, et al. Nature (London) 1994;372:635–641. - PubMed
    1. Merke D P, Tajima T, Baron J, Cutler G B., Jr N Engl J Med. 1999;340:1248–1252. - PubMed
    1. Zhang Y H, Guo W, Wagner R L, Huang B L, McCabe L, Vilain E, Burris T P, Anyane-Yeboa K, Burghes A H, Chitayat D, et al. Am J Hum Genet. 1998;62:855–864. - PMC - PubMed

Publication types

MeSH terms

Substances