. 2000 Dec 19;97(26):14554-9.
doi: 10.1073/pnas.97.26.14554.

A large upstream region is not necessary for gene expression or hypersensitive site formation at the mouse beta -globin locus

Affiliations

A large upstream region is not necessary for gene expression or hypersensitive site formation at the mouse beta -globin locus

C M Farrell et al. Proc Natl Acad Sci U S A. .

Abstract

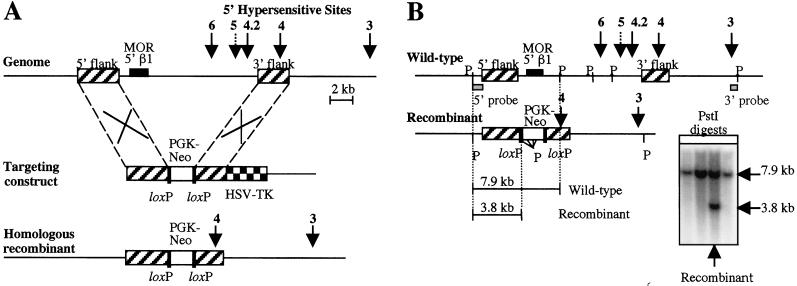
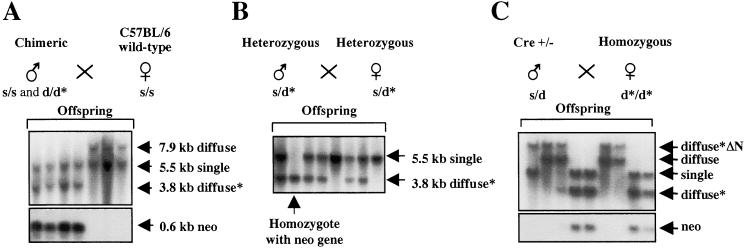
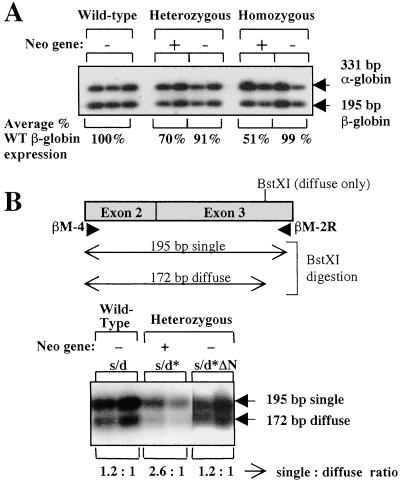
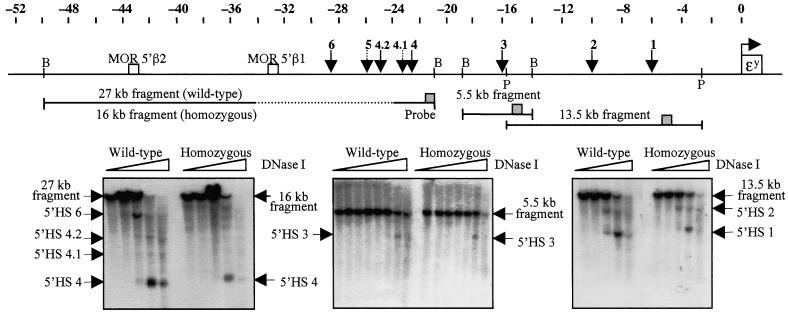
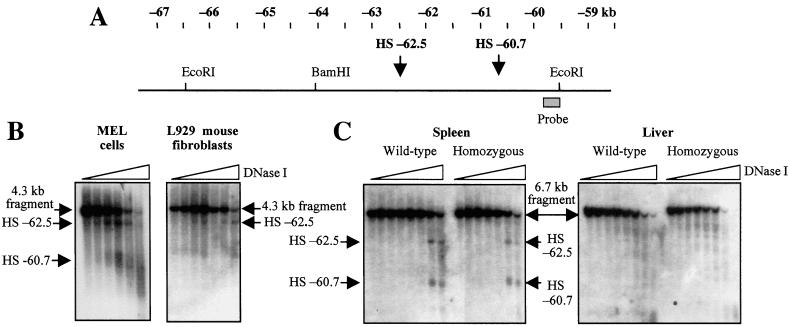
Developmental expression at the beta-globin locus is regulated in part by the locus control region, a region upstream of the genes containing at least five major DNase I hypersensitive sites (HSs) in mammalian erythrocytes. Sequences farther 5' of these HSs are conserved in mouse and human, and both loci are embedded within a cluster of functional odorant receptor genes. In humans, distant upstream sequences have been implicated in regulation of the beta-globin genes. In this study, the role of the 5'-most HSs and their adjacent sequence was investigated by deletion of an 11-kb region from the mouse locus, including 5'HS 4.2, 5'HS 5, 5'HS 6, and the 5'beta1 odorant receptor gene. Mice that were homozygous for this deletion were fully viable, and no significant effect on adult beta-globin gene expression was seen. 5'HSs 1-4, which are located downstream of the deletion, were still present in the mutant mice. In addition, two new upstream HSs, HS -60.7 and HS -62.5, were found in erythroid tissue of both wild-type and mutant mice. Therefore, although the possibility of a minor role still exists, neither the HSs nor the other regions deleted in this study are essential for beta-globin gene expression, and it is unlikely that chromatin structure is affected either upstream or downstream of the deletion. This is the largest deletion at the mouse locus control region to show no apparent phenotype, and focuses attention on the possible contribution of sequences even farther upstream.


Figures

Figure 1
Figure 1
Knockout strategy and screening of ES cells. (A) The upper part of the diagram shows the upstream region of the mouse β-globin locus. The positions of the 5′HSs are indicated by arrows. The dotted arrow indicates that 5′HS 5 is a relatively weak site (10). The boxes with diagonal stripes indicate the positions of the 5′ and 3′ flank sequences used in the targeting construct (center of diagram), where in vivo homologous recombination occurs with the corresponding regions of the genome. The targeting construct also contains a loxP-flanked PGK-neo marker gene for positive selection (white box), and an HSV-TK gene for negative selection (checkered box). The bottom of the diagram shows the expected recombinant allele after the correct targeting event, where the 10,956-bp region between the two flanks is deleted. (B) The diagram shows the screening strategy used to select for correctly targeted clones. The locations of PstI sites are indicated (P) for the wt and recombinant alleles, and the expected fragment sizes that are obtained after PstI digestion and 5′ probe screening are shown. The 5′ probe is a 670-bp PstI to EcoRV fragment indicated on the diagram (gray box). The Southern blot shows a single positive clone that was obtained. This clone was confirmed as positive by additional screening with a 3′ probe (a 605-bp SacI to PstI fragment shown in the diagram).
Figure 2
Figure 2
Generation and screening of mice for the mutation. (A) Chimeric males, which were derived from C57BL/6 blastocysts and targeted ES cells (diffuse haplotype), were mated with wt C57BL/6 females (single haplotype indicated by s). The wt diffuse allele is indicated by d and the mutant allele by d*. Southern blotting of the resulting offspring is shown by using the same screening strategy as in Fig. 1B, and the fragment sizes of the different alleles are indicated. The wt single allele has a different fragment size from the wt diffuse allele because of a restriction site polymorphism. Heterozygous mice (s/d* genotype) also contain a 0.6-kb neomycin PstI fragment (lower blot). (B) Mating and screening of heterozygous mice. A mouse that is homozygous for the mutation (d*/d* genotype) is indicated. All offspring with the d* allele contain the neomycin marker gene. (C) Removal of the neomycin marker gene. Homozygous mice were bred with a mouse carrying a Cre recombinase transgene (28). Mice without the marker gene contain a 12-kb PstI fragment, indicated by diffuse*ΔN. These mice are negative for the neomycin fragment (lower blot).
Figure 3
Figure 3
Expression of adult globin genes. (A) RT-PCR analysis of adult globin genes in circulating blood of adult mice. The gel shows coamplification of adult β-globin mRNA (195-bp product) and α-globin mRNA (331-bp product). The genotypes of the mice and the presence or absence of the neomycin marker gene are indicated at the top of the gel. The average percentage of adult β-globin expression after normalization to α-globin expression is shown at the bottom of the gel. (B) Allelic expression of the adult β-globin genes in heterozygous mice. The diagram shows the expected product after amplification with the primers βM-4 and βM-2R. The position of the BstXI site in the diffuse allele is shown, and the expected fragment sizes after BstXI digestion are also indicated. The expression ratios from the single and diffuse alleles are shown underneath the gel.
Figure 4
Figure 4
DNase I hypersensitivity analysis downstream of the deleted region. The diagram shows a map of the upstream region of the mouse β-globin locus. The positions of the ɛy gene, the 5′ HSs, and two 5′ OR genes are indicated. The locations of the fragments used for hypersensitivity assays are shown, and the positions of BamHI (B) and PstI (P) sites are indicated. The dotted portion of the 27-kb BamHI fragment indicates the region that was deleted. The probe positions on the fragments are indicated by gray boxes. (Left) 5′HS 4 was detected by using a 27-kb BamHI parental fragment (16 kb for homozygotes with the deletion), with a 557-bp EcoRI to SacI fragment as a probe. (Center) 5′HS 3 was detected by using a 5.5-kb BamHI fragment, with a 359-bp SspI to BglII fragment as a probe. (Right) 5′HS 1 and 5′HS 2 were detected by using a 13.5-kb PstI fragment, with the previously described probe x PCR fragment as a probe (37). Mice used for the DNase I series shown were either wt (diffuse/diffuse genotype) or homozygous for the 11-kb mutation (diffuse*ΔN/diffuse*ΔN genotype).
Figure 5
Figure 5
DNase I hypersensitivity analysis upstream of the deleted region. (A) Map of the far upstream region of the mouse β-globin locus. The positions of the two new HSs are indicated. (B) Analysis of hypersensitive sites in murine erythroleukemia cells and L929 cells. The parental band is a 4.3-kb BamHI to EcoRI fragment. The position of the probe, a 285-bp AflIII to EcoRI fragment, is shown in A. (C) Analysis of upstream hypersensitive sites in spleen and liver chromatin of phenylhydrazine-treated mice. The parental band is a 6.7-kb EcoRI to EcoRI fragment, and the probe described in B was used. Mice used for the DNase I series shown were either wt (diffuse/diffuse genotype) or homozygous for the 11-kb mutation (diffuse*ΔN/diffuse*ΔN genotype).

References

    1. Hanscombe O, Whyatt D, Fraser P, Yannoutsos N, Greaves D, Dillon N, Grosveld F. Genes Dev. 1991;5:1387–1394. - PubMed
    1. Martin D I, Fiering S, Groudine M. Curr Opin Genet Dev. 1996;6:488–495. - PubMed
    1. Hardison R, Slightom J L, Gumucio D L, Goodman M, Stojanovic N, Miller W. Gene. 1997;205:73–94. - PubMed
    1. Tuan D, Solomon W, Li Q, London I M. Proc Natl Acad Sci USA. 1985;82:6384–6388. - PMC - PubMed
    1. Moon A M, Ley T J. Proc Natl Acad Sci USA. 1990;87:7693–7697. - PMC - PubMed

LinkOut - more resources