. 2000 Dec 11;151(6):1305-20.
doi: 10.1083/jcb.151.6.1305.

Differential roles for alpha(M)beta(2) integrin clustering or activation in the control of apoptosis via regulation of akt and ERK survival mechanisms

Affiliations

Differential roles for alpha(M)beta(2) integrin clustering or activation in the control of apoptosis via regulation of akt and ERK survival mechanisms

B B Whitlock et al. J Cell Biol. .

Abstract

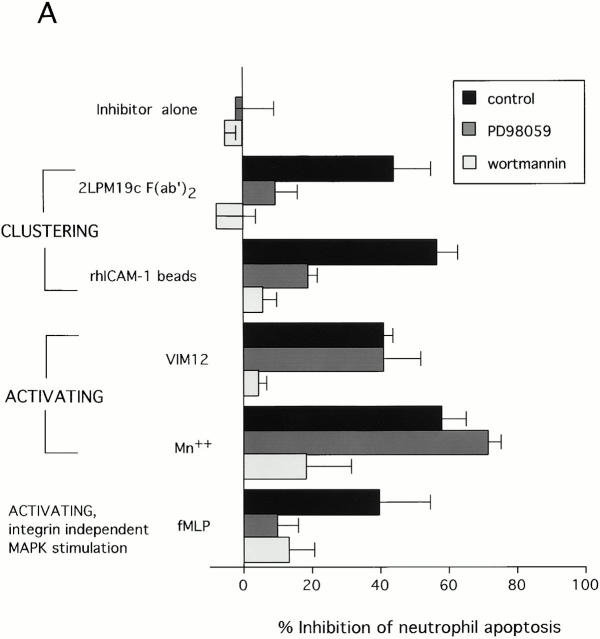
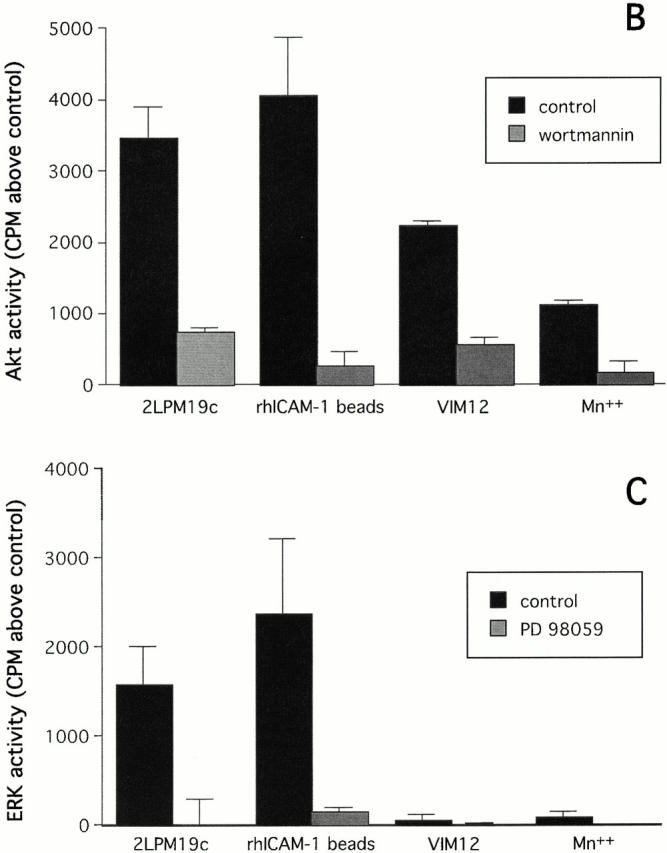
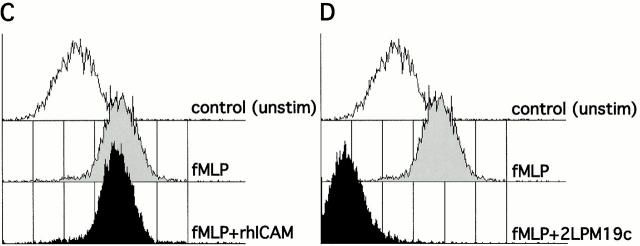
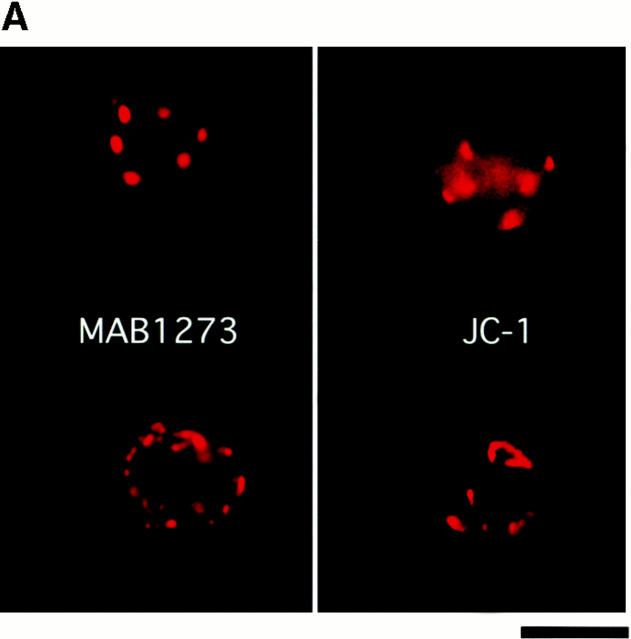
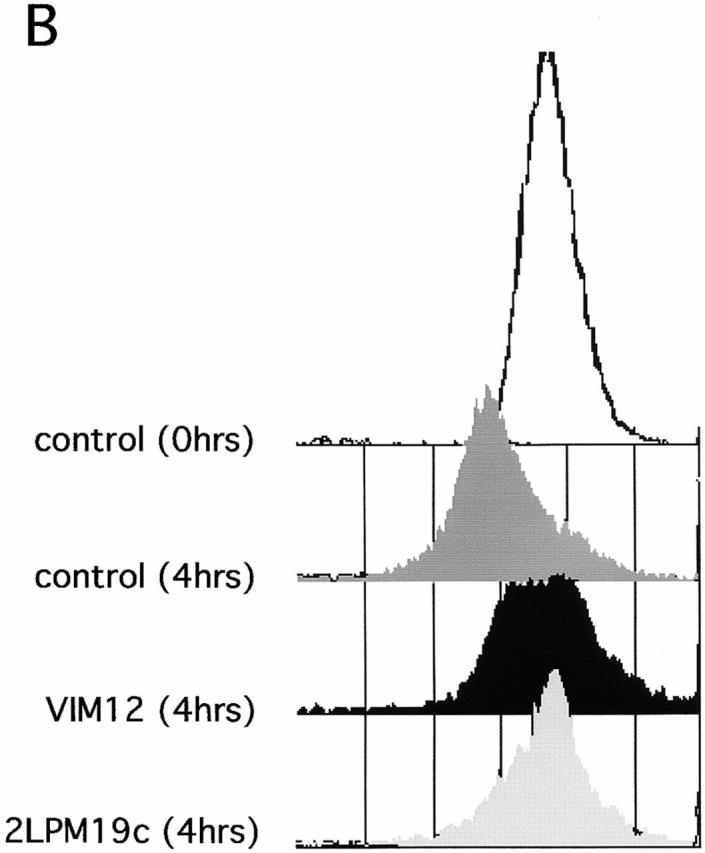
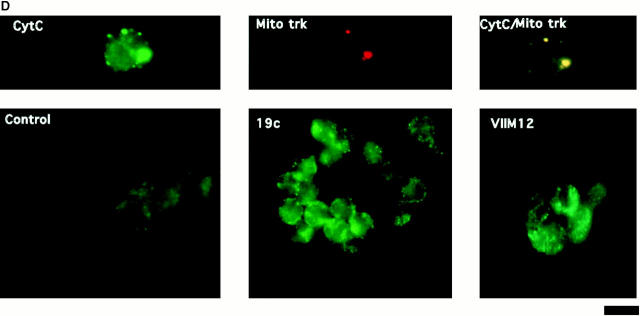
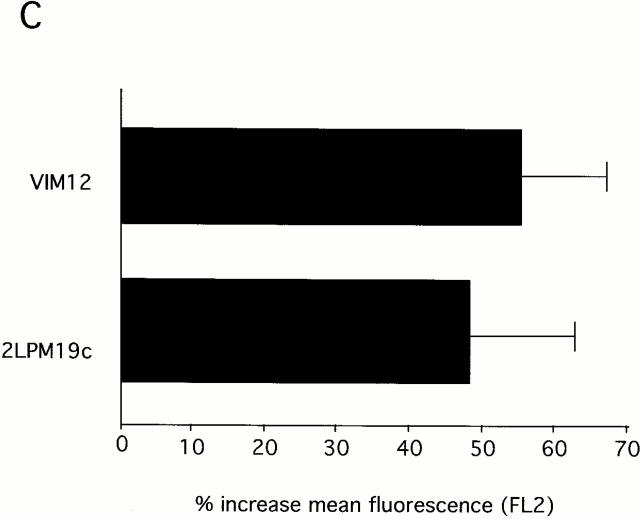
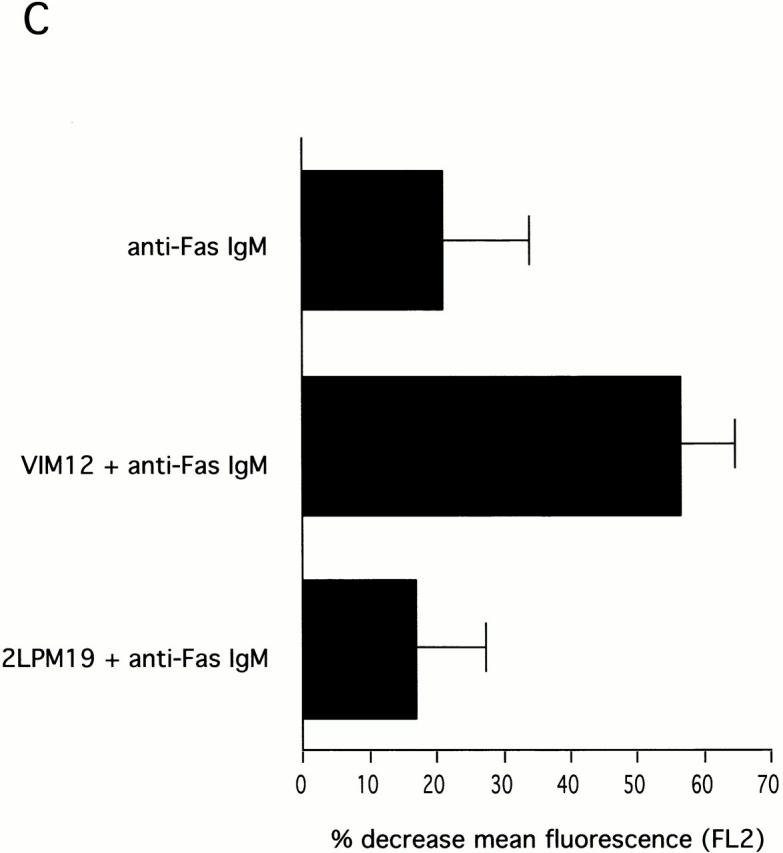
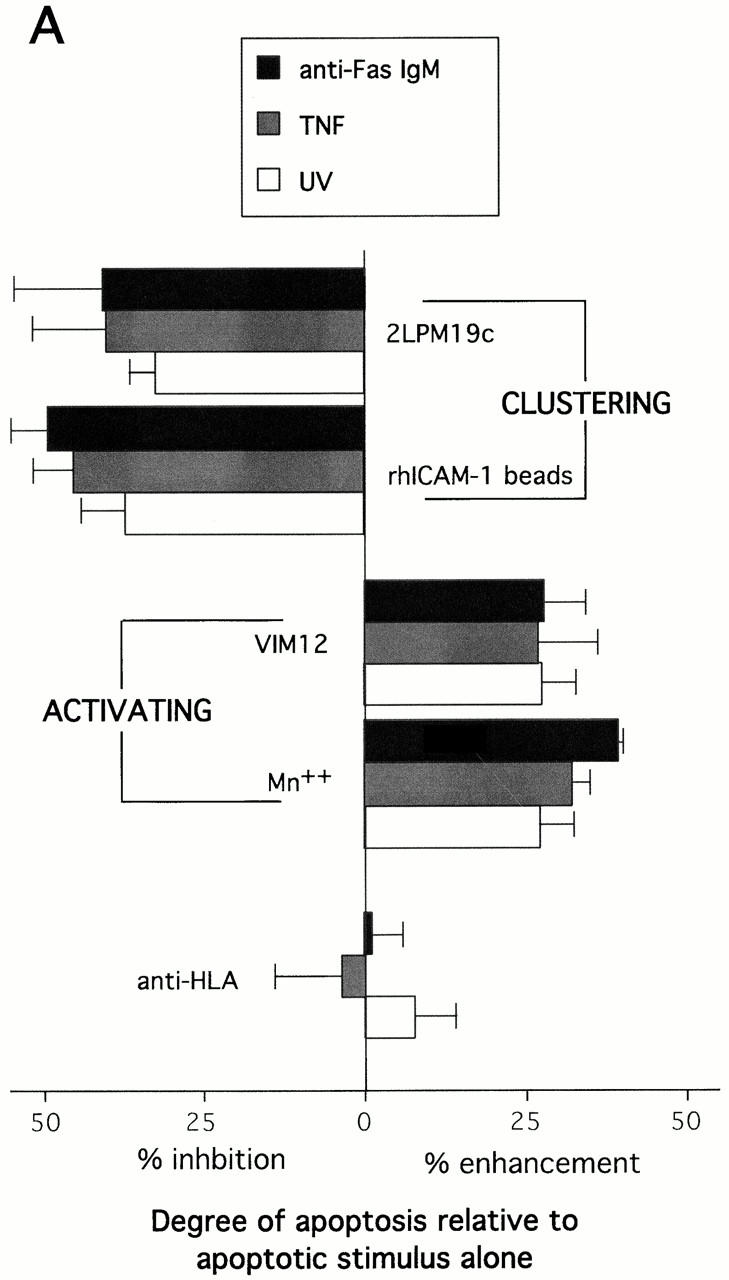
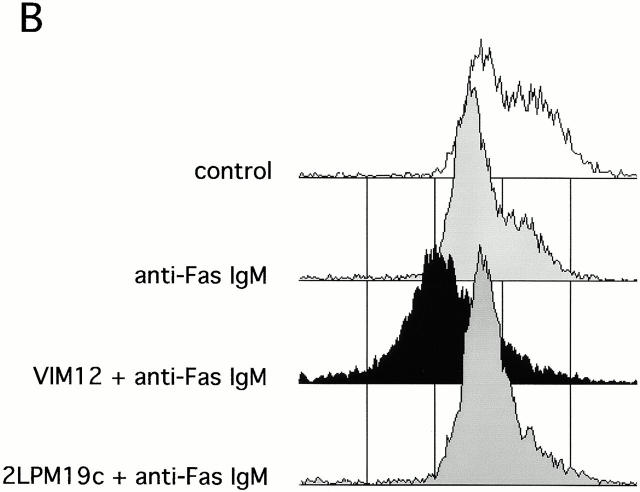
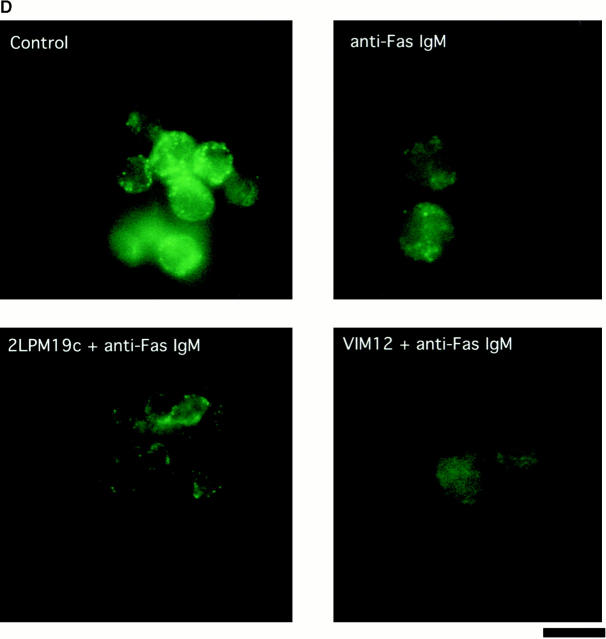
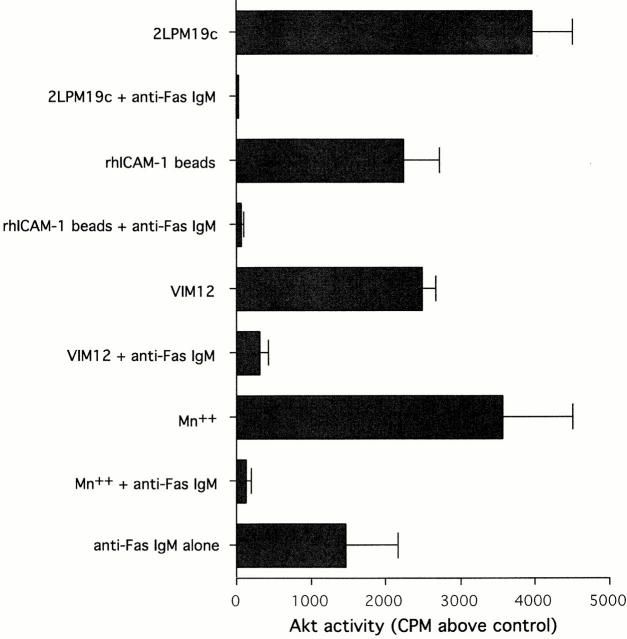
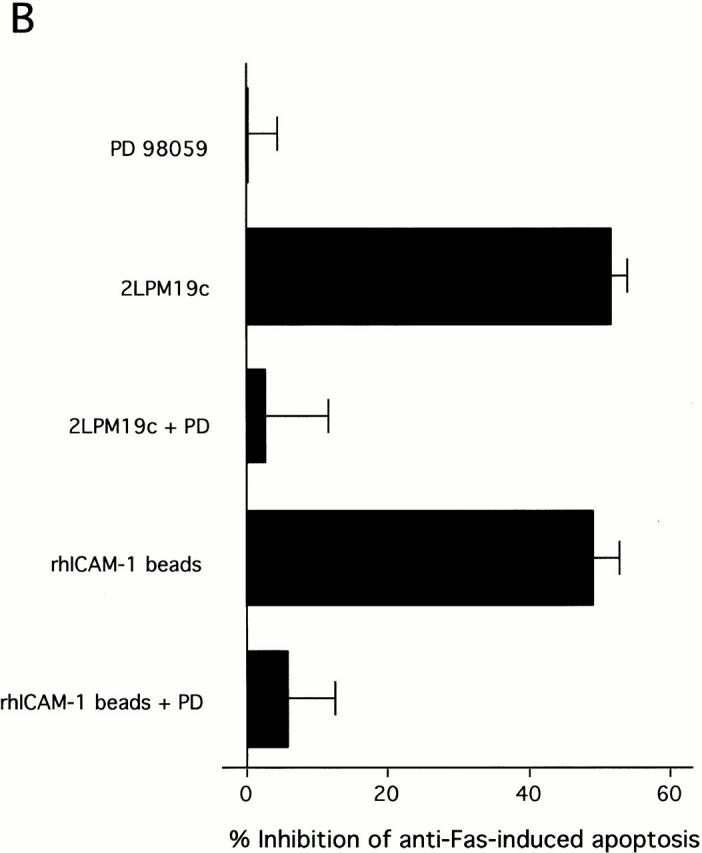
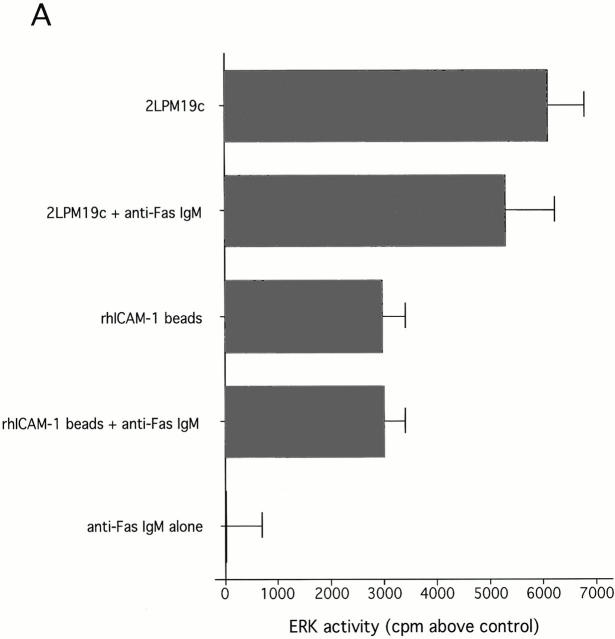
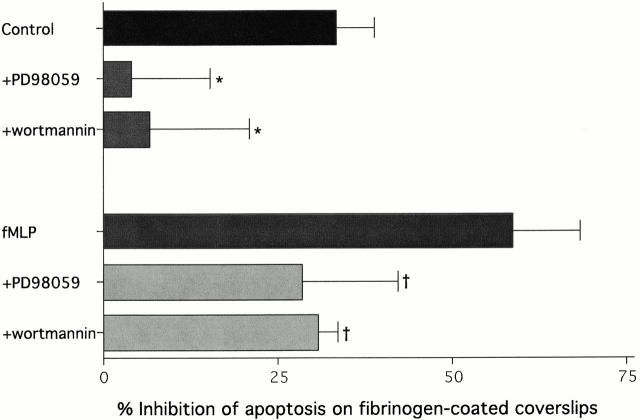
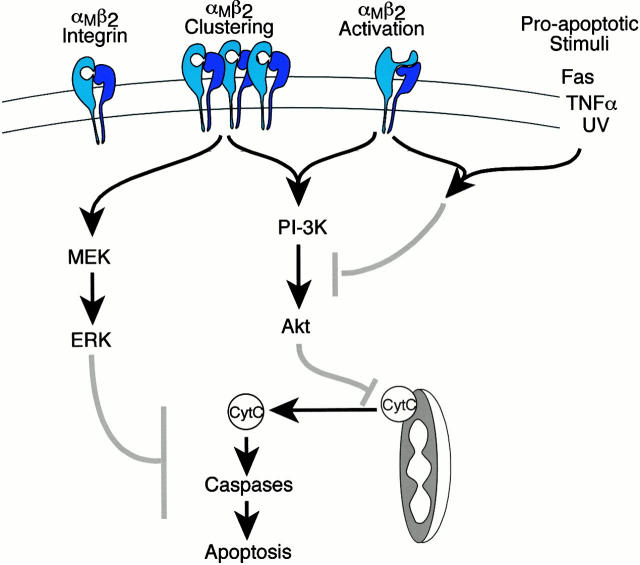
The role of integrins in leukocyte apoptosis is unclear, some studies suggest enhancement, others inhibition. We have found that beta(2)-integrin engagement on neutrophils can either inhibit or enhance apoptosis depending on the activation state of the integrin and the presence of proapoptotic stimuli. Both clustering and activation of alpha(M)beta(2) delays spontaneous, or unstimulated, apoptosis, maintains mitochondrial membrane potential, and prevents cytochrome c release. In contrast, in the presence of proapoptotic stimuli, such as Fas ligation, TNFalpha, or UV irradiation, ligation of active alpha(M)beta(2) resulted in enhanced mitochondrial changes and apoptosis. Clustering of inactive integrins did not show this proapoptotic effect and continued to inhibit apoptosis. This discrepancy was attributed to differential signaling in response to integrin clustering versus activation. Clustered, inactive alpha(M)beta(2) was capable of stimulating the kinases ERK and Akt. Activated alpha(M)beta(2) stimulated Akt, but not ERK. When proapoptotic stimuli were combined with either alpha(M)beta(2) clustering or activation, Akt activity was blocked, allowing integrin activation to enhance apoptosis. Clustered, inactive alpha(M)beta(2) continued to inhibit stimulated apoptosis due to maintained ERK activity. Therefore, beta(2)-integrin engagement can both delay and enhance apoptosis in the same cell, suggesting that integrins can play a dual role in the apoptotic progression of leukocytes.


Figures

Figure 1
Figure 1
Inhibition of spontaneous neutrophil apoptosis by blocking or activating antibodies to β2-integrins. (A) Inhibition of apoptosis was specific for antibodies to αL, αM and β2-integrin chains. Neutrophils (2 × 10⁶ cells/ml) were incubated at 37°C in polypropylene tubes with 1 μg/ml of antibody and apoptosis assessed by cellular morphology at 10 h. The data represent mean percent inhibition of apoptosis ± SD of four experiments. The average control apoptosis at 10 h was 39 ± 11% and the means of all antibody treatments were compared with this value using the multiple comparison Dunnett's Test (*P < 0.05). (B) F(ab′)2 fragments, but not monovalent Fab, of anti-αM mAb 2LPM19c inhibited apoptosis. Mean percent inhibition ± SD of three experiments. (C) Inhibition time course of blocking anti-αM clone (2LPM19c) or activating anti-αM clone (VIM12). Anti-CD45 (HI30) is shown as a negative control. Neutrophils were treated with 1 μg/ml of antibody and apoptosis determined at 2, 10, and 20 h. Graph is representative of five experiments.
Figure 1
Figure 1
Inhibition of spontaneous neutrophil apoptosis by blocking or activating antibodies to β2-integrins. (A) Inhibition of apoptosis was specific for antibodies to αL, αM and β2-integrin chains. Neutrophils (2 × 10⁶ cells/ml) were incubated at 37°C in polypropylene tubes with 1 μg/ml of antibody and apoptosis assessed by cellular morphology at 10 h. The data represent mean percent inhibition of apoptosis ± SD of four experiments. The average control apoptosis at 10 h was 39 ± 11% and the means of all antibody treatments were compared with this value using the multiple comparison Dunnett's Test (*P < 0.05). (B) F(ab′)2 fragments, but not monovalent Fab, of anti-αM mAb 2LPM19c inhibited apoptosis. Mean percent inhibition ± SD of three experiments. (C) Inhibition time course of blocking anti-αM clone (2LPM19c) or activating anti-αM clone (VIM12). Anti-CD45 (HI30) is shown as a negative control. Neutrophils were treated with 1 μg/ml of antibody and apoptosis determined at 2, 10, and 20 h. Graph is representative of five experiments.
Figure 2
Figure 2
Inhibition of neutrophil apoptosis after β2-integrin activation or clustering is reversed by anti-αM Fab. β2-integrins were either activated with Mn2+, activating antibody (VIM12), or fMLP or clustered with immobilized rhICAM. In all cases blockade of apoptosis was reversed by a 10-min preincubation with 1 μg 2LPM19c Fab. Preincubation with anti-HLA Fab (clone W6/32) had no effect. Data represents mean percent apoptosis ± SD of three experiments.
Figure 4
Figure 4
Inhibition of apoptosis by β2-integrin activation involves PI-3K/Akt, whereas inhibition by integrin clustering involves both PI-3K/Akt and MAPK pathways. (A) Neutrophils were preincubated for 10 min with either 30 μM PD98059 or 100 nM wortmannin before the addition of stimuli that activate (MnCl2, VIM12, or fMLP) or cluster (2LPM19c F(ab′)2 or immobilized rhICAM-1) β2-integrins. Concentrations of PD98059 and wortmannin used were chosen based on values reported elsewhere (Alessi et al. 1995; Arcaro and Wynman 1993) and dose response curves for the reversal of apoptosis inhibition. Cells were incubated for 10 h and apoptosis assessed by morphology. Bars represent mean percent inhibition of apoptosis ± SD of three experiments. (B) Activation of Akt by αM integrin clustering (2LPM19c or rhICAM-1 beads) or αM activation (VIM12 or MnCl). Neutrophils were incubated with each stimulus without or with 100 nM wortmannin for 20 min. (C) Activation of ERK by αM integrin clustering (2LPM19c), but not αM activation (VIM12). Cells were treated as in A, except without or with 30 μM PD 98059. Akt and ERK activity was measured as the incorporation of 32P above untreated cells (cpm ± SD; n = 3).
Figure 4
Figure 4
Inhibition of apoptosis by β2-integrin activation involves PI-3K/Akt, whereas inhibition by integrin clustering involves both PI-3K/Akt and MAPK pathways. (A) Neutrophils were preincubated for 10 min with either 30 μM PD98059 or 100 nM wortmannin before the addition of stimuli that activate (MnCl2, VIM12, or fMLP) or cluster (2LPM19c F(ab′)2 or immobilized rhICAM-1) β2-integrins. Concentrations of PD98059 and wortmannin used were chosen based on values reported elsewhere (Alessi et al. 1995; Arcaro and Wynman 1993) and dose response curves for the reversal of apoptosis inhibition. Cells were incubated for 10 h and apoptosis assessed by morphology. Bars represent mean percent inhibition of apoptosis ± SD of three experiments. (B) Activation of Akt by αM integrin clustering (2LPM19c or rhICAM-1 beads) or αM activation (VIM12 or MnCl). Neutrophils were incubated with each stimulus without or with 100 nM wortmannin for 20 min. (C) Activation of ERK by αM integrin clustering (2LPM19c), but not αM activation (VIM12). Cells were treated as in A, except without or with 30 μM PD 98059. Akt and ERK activity was measured as the incorporation of 32P above untreated cells (cpm ± SD; n = 3).
Figure 3
Figure 3
Clustering and activation of αMβ2 integrin on neutrophils. (A) Activating (VIM12) and blocking (2LPM19c) antibodies to αM are capable of integrin clustering at 37°C, but not at 4°C. Fresh neutrophils were incubated with 2 μg/ml of either VIM12 or 2LPM19c at 4 or 37°C for 45 min and stained as in Materials and Methods. Figures are representative of four experiments. Bar, 5 μm. (B) VIM12 treatment, but not rhICAM-1 beads, induced αM-integrin activation as measured by mAb CBRM 1/5 binding. Neutrophils were treated as above with either VIM12 or rhICAM beads (1 μg of total ICAM) and were then stained as in Materials and Methods. To assess total β2-integrin levels, cells were stained with FITC–anti-CD18. Histograms are representative of six experiments. (C and D) Blocking of fMLP-stimulated CBRM1/5 binding by 2LPM19c (D), but not rhICAM-1 beads (C). Neutrophils were treated with 2LPM19c or rhICAM-1 beads as above, followed by a 5 min incubation with fMLP and staining with biotinylated CBRM1/5. Histograms are representative of four experiments.
Figure 3
Figure 3
Clustering and activation of αMβ2 integrin on neutrophils. (A) Activating (VIM12) and blocking (2LPM19c) antibodies to αM are capable of integrin clustering at 37°C, but not at 4°C. Fresh neutrophils were incubated with 2 μg/ml of either VIM12 or 2LPM19c at 4 or 37°C for 45 min and stained as in Materials and Methods. Figures are representative of four experiments. Bar, 5 μm. (B) VIM12 treatment, but not rhICAM-1 beads, induced αM-integrin activation as measured by mAb CBRM 1/5 binding. Neutrophils were treated as above with either VIM12 or rhICAM beads (1 μg of total ICAM) and were then stained as in Materials and Methods. To assess total β2-integrin levels, cells were stained with FITC–anti-CD18. Histograms are representative of six experiments. (C and D) Blocking of fMLP-stimulated CBRM1/5 binding by 2LPM19c (D), but not rhICAM-1 beads (C). Neutrophils were treated with 2LPM19c or rhICAM-1 beads as above, followed by a 5 min incubation with fMLP and staining with biotinylated CBRM1/5. Histograms are representative of four experiments.
Figure 5
Figure 5
Both β2-integrin activation and clustering maintains mitochondria membrane potential and prevents cytochrome c release. (A) Identification and localization of mitochondria in neutrophils. Fresh cells were stained with either a mitochondria marker MAB1273 (1 μg) or the mitochondria permeable dye JC-1 (10 μM), and analyzed by fluorescent microscopy. Two cells stained with each reagent are shown. Bar, 5 μm. (B and C) αMβ2 integrin-mediated maintenance of mitochondria membrane potential. Fresh neutrophils (0 h), or neutrophils incubated for 4 h without or with VIM12 or 2LPM19c, were stained with 10 μM JC-1 and analyzed by flow cytometry. B shows representative histograms from 3 individual experiments. (C) Bars represent the mean percent increase in JC-1 fluorescence over cells at 4 h ± SD (n = 3). (D) αMβ2 integrin-mediated prevention of CytC release. Neutrophils were incubated for 1.5 h as above, permeabilized, and stained with anti-CytC antibody as in Kennedy et al. 1999. Mitochondria specific staining of anti-CytC was confirmed in fresh neutrophils by co-staining with mitotracker red (Mito trk) with colocalization verified by overlaid green/red fluorescence (CytC/Mito trk). Bar, 5 μm.
Figure 5
Figure 5
Both β2-integrin activation and clustering maintains mitochondria membrane potential and prevents cytochrome c release. (A) Identification and localization of mitochondria in neutrophils. Fresh cells were stained with either a mitochondria marker MAB1273 (1 μg) or the mitochondria permeable dye JC-1 (10 μM), and analyzed by fluorescent microscopy. Two cells stained with each reagent are shown. Bar, 5 μm. (B and C) αMβ2 integrin-mediated maintenance of mitochondria membrane potential. Fresh neutrophils (0 h), or neutrophils incubated for 4 h without or with VIM12 or 2LPM19c, were stained with 10 μM JC-1 and analyzed by flow cytometry. B shows representative histograms from 3 individual experiments. (C) Bars represent the mean percent increase in JC-1 fluorescence over cells at 4 h ± SD (n = 3). (D) αMβ2 integrin-mediated prevention of CytC release. Neutrophils were incubated for 1.5 h as above, permeabilized, and stained with anti-CytC antibody as in Kennedy et al. 1999. Mitochondria specific staining of anti-CytC was confirmed in fresh neutrophils by co-staining with mitotracker red (Mito trk) with colocalization verified by overlaid green/red fluorescence (CytC/Mito trk). Bar, 5 μm.
Figure 6
Figure 6
Stimulus-induced apoptosis and mitochondrial changes were enhanced by αMβ2 activation. (A) Activated αMβ2, but not clustered, inactivated αMβ2, enhanced apoptosis induced by TNF α, anti-Fas IgM, or UV irradiation. VIM12 and 2LPM19c were added simultaneously with anti-Fas IgM or TNF α and allowed to incubate for 4 h. UV treated cells were allowed to incubate with antibodies for 1 h before a 5 min UV exposure; cells were then incubated for 2 h. Bars represent the mean percent change in apoptosis compared with untreated cells ± SD (n = 3). Average control apoptosis levels were 46% for anti-Fas, 27% for TNFα, and 49% for UV-treated cells. (B and C) αMβ2 activation in combination with anti-Fas resulted in increased reduction of mitochondria membrane potential. Cells were incubated for 4 h with anti-Fas IgM without or with antibodies. JC-1 staining and analysis was carried out as in Fig. 5. (B) Histograms are representative of three experiments. (C) Bars represent the mean percent decrease in FL2 compared with 4 h cells ± SD (n = 3). (D) αMβ2 activation in combination with anti-Fas resulted in greater CytC release from mitochondria. Cells were treated and stained for CytC as above. The intensity of these images was increased relative to Fig. 5 D to illustrate loss of CytC staining upon incubation with anti-Fas and anti-Fas plus VIM12. Bar, 10 μm.
Figure 6
Figure 6
Stimulus-induced apoptosis and mitochondrial changes were enhanced by αMβ2 activation. (A) Activated αMβ2, but not clustered, inactivated αMβ2, enhanced apoptosis induced by TNF α, anti-Fas IgM, or UV irradiation. VIM12 and 2LPM19c were added simultaneously with anti-Fas IgM or TNF α and allowed to incubate for 4 h. UV treated cells were allowed to incubate with antibodies for 1 h before a 5 min UV exposure; cells were then incubated for 2 h. Bars represent the mean percent change in apoptosis compared with untreated cells ± SD (n = 3). Average control apoptosis levels were 46% for anti-Fas, 27% for TNFα, and 49% for UV-treated cells. (B and C) αMβ2 activation in combination with anti-Fas resulted in increased reduction of mitochondria membrane potential. Cells were incubated for 4 h with anti-Fas IgM without or with antibodies. JC-1 staining and analysis was carried out as in Fig. 5. (B) Histograms are representative of three experiments. (C) Bars represent the mean percent decrease in FL2 compared with 4 h cells ± SD (n = 3). (D) αMβ2 activation in combination with anti-Fas resulted in greater CytC release from mitochondria. Cells were treated and stained for CytC as above. The intensity of these images was increased relative to Fig. 5 D to illustrate loss of CytC staining upon incubation with anti-Fas and anti-Fas plus VIM12. Bar, 10 μm.
Figure 7
Figure 7
Fas ligation plus β2-integrin activation or clustering prevented Akt activation. Cells were preincubated with or without anti-Fas IgM for 5 min before incubation with antibodies, rhICAM-1 beads, or MnCl2 for 20 min. Akt activity was measured as in Fig. 4. Bars represent 32P incorporated above untreated cells (cpm ± SD; n = 3). Similar effects were seen with TNFα (data not shown).
Figure 8
Figure 8
Clustering of β2-integrins inhibits Fas-induced apoptosis (in the absence of Akt) via continued ERK activation. (A) Cells were preincubated without or with anti-Fas IgM for 5 min before incubation with 2LPM19c or rhICAM beads for 20 min. ERK activity was measured as in Fig. 4. (B) Cells were treated with PD98059 as in Fig. 3, followed by the addition of 2LPM19c or rhICAM-1 beads and anti-Fas IgM. Apoptosis was assessed at 4 h. Bars represents mean percent inhibition ± SD (n = 3).
Figure 8
Figure 8
Clustering of β2-integrins inhibits Fas-induced apoptosis (in the absence of Akt) via continued ERK activation. (A) Cells were preincubated without or with anti-Fas IgM for 5 min before incubation with 2LPM19c or rhICAM beads for 20 min. ERK activity was measured as in Fig. 4. (B) Cells were treated with PD98059 as in Fig. 3, followed by the addition of 2LPM19c or rhICAM-1 beads and anti-Fas IgM. Apoptosis was assessed at 4 h. Bars represents mean percent inhibition ± SD (n = 3).
Figure 9
Figure 9
Neutrophil apoptosis is inhibited on fibrinogen in a PI-3K and MAPK dependent manner. 111In-labeled neutrophils (6 × 10⁴ cells/ml) were incubated either in suspension or on fibrinogen-coated glass coverslips. After a 4 h incubation, cells were fixed, nonadherent and adherent cells were separated and stained with DAPI to measure apoptosis. PD 98059 (30 μM) and wortmannin (100 nM) were added after labeling 15 min before plating. Apoptotic percentages were calculated as outlined in the Materials and Methods. Graph represents the percent inhibition of apoptosis on fibrinogen compared with suspension culture. Bars represent the mean ± SD (n = 5). The significance of reversal of inhibition by PD98059 and wortmannin was determined by single mean comparisons to control percent inhibition using the Tukey-Kramer test (*P < 0.05, compared with control inhibition; P < 0.05, compared with fMLP-stimulated inhibition).
Figure 10
Figure 10
The role of β2-integrin clustering and activation in neutrophil survival. Signaling model shows pathways activated upon αMβ2 clustering or activation with arrows indicating stimulatory cascades and gray bars indicating potential points of inhibition of apoptotic signaling. β2-integrin structures are modeled after Stewart and Hogg 1996.

Similar articles

Cited by

References

    1. Alessi D.R., Cuenda A., Cohen P., Dudley D.T., Saltiel A.R. PD 98059 is a specific inhibitor of the activation of mitogen-activated protein kinase in vitro and in vivo. J. Biol. Chem. 1995;270:27489–27494. - PubMed
    1. Altieri D.C. Occupancy of CD11b/CD18 (Mac-1) divalent ion binding site(s) induces leukocyte adhesion. J. Immunol. 1991;147:1891–1898. - PubMed
    1. Arcaro A., Wynman M.P. Wortmannin is a potent phosphatidylinositol 3-kinase inhibitorthe role of phosphatidylinositol 3,4,5-trisphophate in neutrophil responses. Biochem. J. 1993;296:297–301. - PMC - PubMed
    1. Bleijs D.A., Binnerts M.E., van Vliet S.J., Figdor C.G., van Kooyk Y. Low-affinity LFA-1/ICAM-3 interactions augment LFA-1/ICAM-1-mediated T cell adhesion and signaling by redistribution of LFA-1. J. Cell Sci. 2000;113:391–400. - PubMed
    1. Chuang P.I., Yee E., Karsan A., Winn R.K., Harlan J.M. A1 is a constitutive and inducible Bcl-2 homologue in mature human neutrophils. Biochem. Biophys. Res. Comm. 1998;249:361–365. - PubMed

Publication types