. 2000 Dec 11;151(6):1321-36.
doi: 10.1083/jcb.151.6.1321.

Expression profiling in the muscular dystrophies: identification of novel aspects of molecular pathophysiology

Affiliations

Expression profiling in the muscular dystrophies: identification of novel aspects of molecular pathophysiology

Y W Chen et al. J Cell Biol. .

Abstract

We used expression profiling to define the pathophysiological cascades involved in the progression of two muscular dystrophies with known primary biochemical defects, dystrophin deficiency (Duchenne muscular dystrophy) and alpha-sarcoglycan deficiency (a dystrophin-associated protein). We employed a novel protocol for expression profiling in human tissues using mixed samples of multiple patients and iterative comparisons of duplicate datasets. We found evidence for both incomplete differentiation of patient muscle, and for dedifferentiation of myofibers to alternative lineages with advancing age. One developmentally regulated gene characterized in detail, alpha-cardiac actin, showed abnormal persistent expression after birth in 60% of Duchenne dystrophy myofibers. The majority of myofibers ( approximately 80%) remained strongly positive for this protein throughout the course of the disease. Other developmentally regulated genes that showed widespread overexpression in these muscular dystrophies included embryonic myosin heavy chain, versican, acetylcholine receptor alpha-1, secreted protein, acidic and rich in cysteine/osteonectin, and thrombospondin 4. We hypothesize that the abnormal Ca(2)+ influx in dystrophin- and alpha-sarcoglycan-deficient myofibers leads to altered developmental programming of developing and regenerating myofibers. The finding of upregulation of HLA-DR and factor XIIIa led to the novel identification of activated dendritic cell infiltration in dystrophic muscle; these cells mediate immune responses and likely induce microenvironmental changes in muscle. We also document a general metabolic crisis in dystrophic muscle, with large scale downregulation of nuclear-encoded mitochondrial gene expression. Finally, our expression profiling results show that primary genetic defects can be identified by a reduction in the corresponding RNA.


Figures
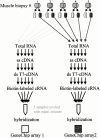
Figure 1
Figure 1
Experimental protocol employed for expression array analyses.
Figure 4
Figure 4
Comparison of differentially expressed genes in dystrophin deficiency and α-SGD expressed as fold changes compared with normal muscle. Both graphs show average fold changes >2 on a log scale. Those spots on the diagonal represent genes that show a similar expression change in both dystrophin deficiency and α-SGD, whereas those lying off the horizontal show greater differences in one or the other dystrophy. (A) The graph includes all difference calls that included one or more tilda values (∼). This includes difference values where the expression level in any single dataset approaches the noise level, leading to an absent or marginal call. This often leads to a very large value for the ratio (e.g., dividing by zero) for determination of fold change, with a resulting exaggeration of the difference, and a higher probability of lying off the diagonal. Many of these tilda genes are those that show little or no expression in normal muscle, and are increased in the muscular dystrophies. (B) The graph shows removal of all data showing tildas. These genes have a strong confidence level with regards to the extent of the difference with normal muscle, and also the relative difference with regards to the two muscular dystrophies. Of particular note is the disease-specific decrease of ERK6 in dystrophin deficiency, and the very large increases in many developmentally regulated muscle genes that are shared by both muscular dystrophies.
Figure 2
Figure 2
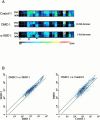
Expression profile data for pooled muscular dystrophy patient biopsies. (A) Example of raw data of probe sets for ERK6 in normal pooled controls (Control 1), DMD (DMD1), and α-sarcoglycan–deficient (α-SGD1) patient biopsies. Shown are 20 probe pairs for the ERK6 gene on the GeneChip® HuGeneFL array, with the top feature of each pair showing hybridization of RNA to the perfect match probe (PM), and the lower feature showing the mismatched control probe (MM). Relative quantitation of averaged features is provided, as well as the difference call (e.g., increase or decrease) comparing DMD1 and α-SGD1 to the control 1 dataset. This analysis shows a 10-fold reduction of ERK6 mRNA specific for DMD. Probe pairs whose performance is inconsistent with the rest of probe set are indicated, with one showing equal hybridization with match and mismatch (#), one showing likely cross-reactivity to a more abundant RNA sequence (*), and one showing lack of hybridization (+). The color bar indicates intensity ranged from 500 to 20,000. (B) Scatter graph representation of comparative data, with axes showing relative expression levels of probe sets for each gene. Shown are single comparisons of expression profiling data sets (DMD1 versus DMD2; Control 1 versus DMD1). Lack of concordance between DMD1 and DMD2 represents combined experimental error, including tissue heterogeneity in muscle biopsy. Only “present” calls are shown, which represent ∼2,000 of the 6,000 genes tested. Comparison of control 1 and DMD1 data sets shows considerably more spread in expression levels throughout the intensity range, indicating gene expression relevant to dystrophin deficiency in muscle. The solid lines indicate twofold difference cutoff.
Figure 3
Figure 3
Iterative comparisons of duplicate data sets result in stringent determination of differentially expressed genes. (A) The effect of sequential iterative comparisons between DMD and control gene expression profiles is shown. A single data set comparison shows ∼250 increase and 250 decrease calls. Iterative comparisons of two independent data sets result in a decreasing number of difference calls that survive all comparisons (158 increase and 155 decrease calls after two comparisons; 137 increase and 135 decrease calls after four comparisons). (B) The same iterative analysis of α-sarcoglycan–deficient muscle versus normal controls is shown. A similar decline in surviving difference calls is seen.
Figure 5
Figure 5
Immunolocalization of factor XIIIa shows colocalization with HLA-DR in tissue dendritic cells. (A–C) Immunofluorescent visualization of factor XIIIa in frozen muscle biopsy sections from DMD (A), α-SGD (B), and normal control (C) are shown. Factor XIIIa localizes to infiltrating connective tissue cells in both dystrophin- and α-sarcoglycan–deficient muscle; these cells are absent in control muscle. Double staining of dystrophin-deficient muscle with factor XIIIa (D) and HLA-DR (E) shows colocalization of these proteins in the majority of cells, suggesting that these are infiltrating dendritic cells. These cells were variably positive for other dendritic cell markers, with subsets also positive for CD1a and CD1b in the epimysial connective tissue (dermal dendritic cells), and other subsets positive for CD14 in the endomysial connective tissue (stationary macrophages) (data not shown). Macrophages infiltrating necrotic fibers were not stained for factor XIIIa (data not shown).
Figure 6
Figure 6
Versican and thrombospondin IV show upregulation in dystrophin- and α-sarcoglycan–deficient muscle. (A–C) Shown are sections from dystrophin-deficient (A), α-sarcoglycan–deficient (B), and normal control (C) muscle biopsies immunostained for the large chondroitin sulfate proteoglycan, versican. Upregulation of versican is seen in the endomysial connective tissue in both dystrophin- and α-sarcoglycan–deficient muscle. (D–G) Shown are adjacent sections immunostained for thrombospondin IV (D and F), and stained with hematoxylin and eosin (E and G). A region of grouped necrosis of myofibers is seen in the α-sarcoglycan–deficient muscle (E). This same region shows a large increase in thrombospondin IV protein production (D). However, in the dystrophin-deficient muscle, regions with upregulation of thrombospondin IV (F) do not show obvious necrosis in the adjacent sections stained with hematoxylin and eosin (G).
Figure 7
Figure 7
Developmentally regulated myogenic proteins are persistently upregulated in dystrophin- and α-sarcoglycan–deficient muscle. (A–E) Shown are immunostainings for α-cardiac actin, with quantitation of the percent of α-cardiac–actin positive myofibers in a series of muscle biopsies (F). Muscles from patients with dystrophin deficiency (A), α-SGD (B), normal control (C), and a female manifesting carrier for dystrophin deficiency (D) are shown. Immunostaining for dystrophin (E) shows mosaic pattern of immunostaining in the female carrier, with both dystrophin-positive and dystrophin-negative cells. For quantitation, the number of patients employed is shown on the top of the column at each time point (F). For each patient, three different fields were counted. The bars indicate the standard deviation derived from three individuals when three patients were studied, or three fields when only one individual was included. At the 8–23-yr time point, three 8-yr-old dystrophin-deficiency patients, one 15-yr-old calpain 3–deficiency patient, and one 23-yr-old merosin-deficiency patient were counted. α-Cardiac actin is developmentally regulated during early muscle development, but shows little or no expression in normal muscle from birth onwards (C and F). Both show dramatic upregulation in dystrophic muscle, despite little evidence of actively regenerating fibers in the dystrophin deficiency (A) and α-sarcoglycan–deficient (B) muscles. The α-sarcoglycan–deficient muscle also shows atrophic, angulated fibers (arrows) suggestive of either failed regeneration or denervation; these fibers are also positive for α-cardiac actin (B). In the female mosaic for dystrophin deficiency, immunostaining for α-cardiac actin shows both dystrophin-positive and -negative cells to stain positively.
Figure 7
Figure 7
Developmentally regulated myogenic proteins are persistently upregulated in dystrophin- and α-sarcoglycan–deficient muscle. (A–E) Shown are immunostainings for α-cardiac actin, with quantitation of the percent of α-cardiac–actin positive myofibers in a series of muscle biopsies (F). Muscles from patients with dystrophin deficiency (A), α-SGD (B), normal control (C), and a female manifesting carrier for dystrophin deficiency (D) are shown. Immunostaining for dystrophin (E) shows mosaic pattern of immunostaining in the female carrier, with both dystrophin-positive and dystrophin-negative cells. For quantitation, the number of patients employed is shown on the top of the column at each time point (F). For each patient, three different fields were counted. The bars indicate the standard deviation derived from three individuals when three patients were studied, or three fields when only one individual was included. At the 8–23-yr time point, three 8-yr-old dystrophin-deficiency patients, one 15-yr-old calpain 3–deficiency patient, and one 23-yr-old merosin-deficiency patient were counted. α-Cardiac actin is developmentally regulated during early muscle development, but shows little or no expression in normal muscle from birth onwards (C and F). Both show dramatic upregulation in dystrophic muscle, despite little evidence of actively regenerating fibers in the dystrophin deficiency (A) and α-sarcoglycan–deficient (B) muscles. The α-sarcoglycan–deficient muscle also shows atrophic, angulated fibers (arrows) suggestive of either failed regeneration or denervation; these fibers are also positive for α-cardiac actin (B). In the female mosaic for dystrophin deficiency, immunostaining for α-cardiac actin shows both dystrophin-positive and -negative cells to stain positively.
Figure 8
Figure 8
Pathophysiological flow chart of the muscular dystrophies.

Comment in

References

    1. Alberti S., Alvarez D., Merino S., Casado M.T., Vivanco F., Tomas J.M., Benedi V.J. Analysis of complement C3 deposition and degradation on Klebsiella pneumoniae . Infect. Immun. 1996;64:4726–4732. - PMC - PubMed
    1. Alon U., Barkai N., Notterman D.A., Gish K., Ybarra S., Mack D., Levine A.J. Broad patterns of gene expression revealed by clustering analysis of tumor and normal colon tissues probed by oligonucleotide arrays. Proc. Natl. Acad. Sci. USA. 1999;96:6745–6750. - PMC - PubMed
    1. Arber S., Caroni P. Thrombospondin-4, an extracellular matrix protein expressed in the developing and adult nervous system promotes neurite outgrowth. J. Cell Biol. 1995;131:1083–1094. - PMC - PubMed
    1. Barbiroli B., Funicello R., Iotti S., Montagna P., Ferlini A., Zaniol P. 31P-NMR spectroscopy of skeletal muscle in Becker dystrophy and DMD/BMD carriers. Altered rate of phosphate transport. J. Neurol. Sci. 1992;109:188–195. - PubMed
    1. Bonnemann C.G., Modi R., Noguchi S., Mizuno Y., Yoshida M., Gussoni E., McNally E.M., Duggan D.J., Angelini C., Hoffman E.P. Beta-sarcoglycan (A3b) mutations cause autosomal recessive muscular dystrophy with loss of the sarcoglycan complex. Nat. Genet. 1995;11:266–273. - PubMed

Publication types

MeSH terms