. 2000 Dec 15;28(24):4846-55.
doi: 10.1093/nar/28.24.4846.

Characterization of the B lymphocyte-induced maturation protein-1 (Blimp-1) gene, mRNA isoforms and basal promoter

Affiliations

Characterization of the B lymphocyte-induced maturation protein-1 (Blimp-1) gene, mRNA isoforms and basal promoter

C Tunyaplin et al. Nucleic Acids Res. .

Abstract

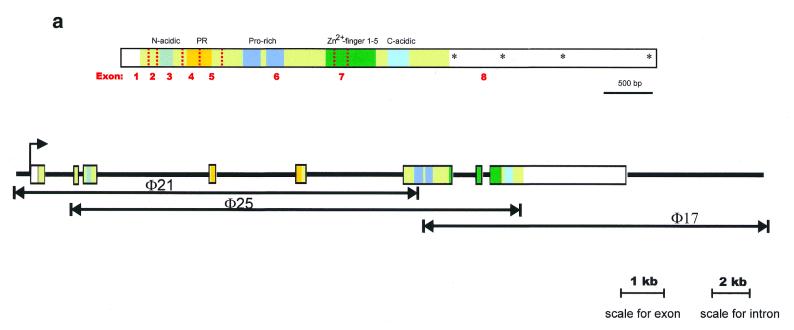
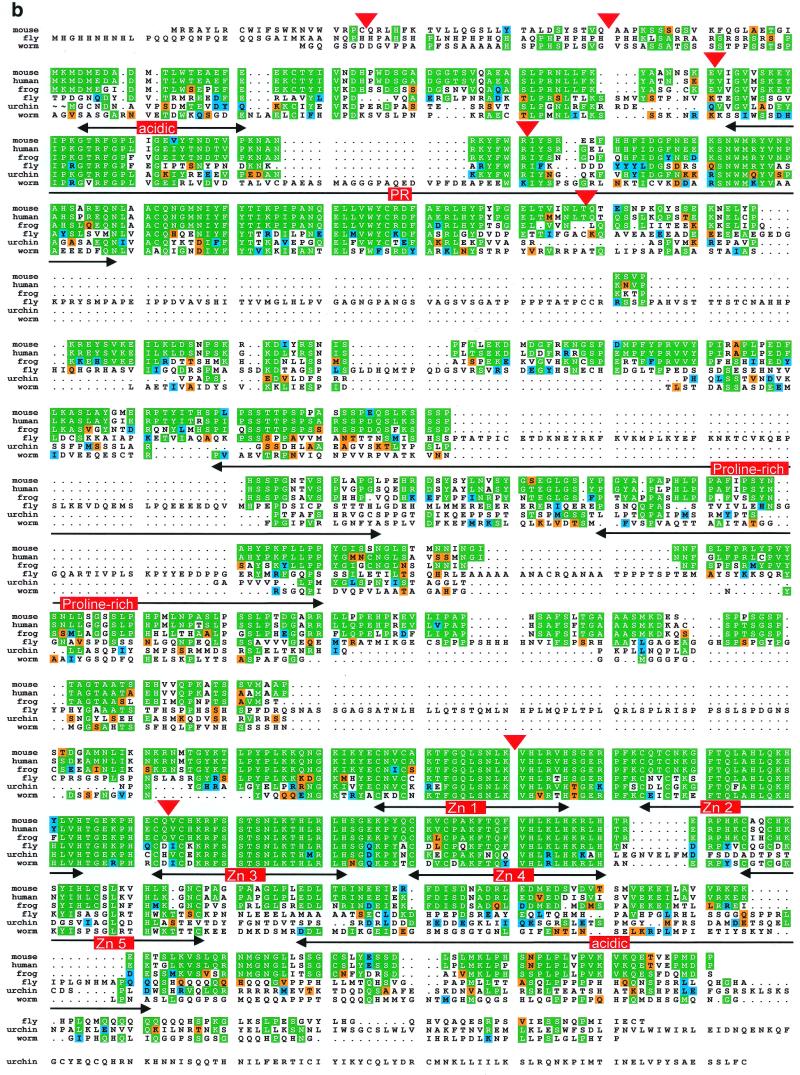
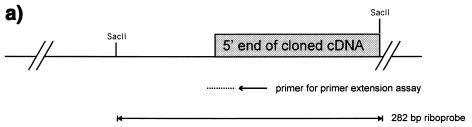
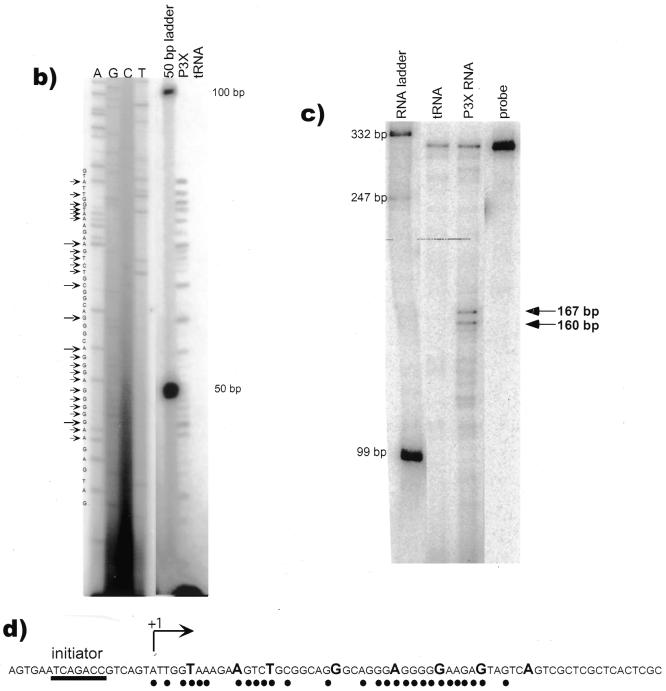
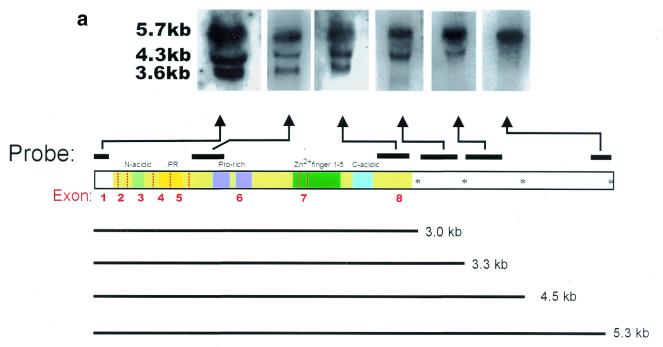
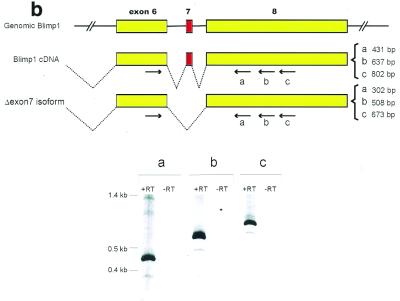
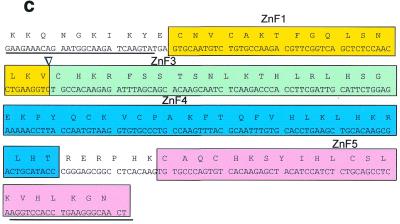
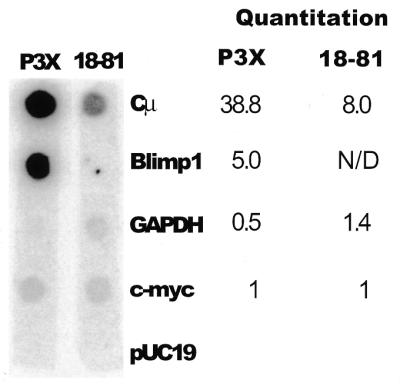
Blimp-1 is a transcriptional repressor that is both required and sufficient to trigger terminal differentiation of B lymphocytes and monocyte/macrophages. Here we report the organization of the mouse Blimp-1 gene, an analysis of Blimp-1 homologs in different species, the characterization of Blimp-1 mRNA isoforms and initial studies on the transcription of Blimp-1. The murine Blimp-1 gene covers approximately 23 kb and contains eight exons. There are Blimp-1 homologs in species evolutionarily distant from mouse (Caenorhabditis elegans and Drosophila melanogaster) but no homolog was found in the unicellular yeast Saccharomyces cerevisiae. The three major Blimp-1 mRNA isoforms result from the use of different polyadenylation sites and do not encode different proteins. Run-on transcription analyses were used to show that the developmentally regulated expression of Blimp-1 mRNA in B cells is determined by transcription initiation. Multiple Blimp-1 transcription initiates sites were mapped near an initiator element and a region conferring basal promoter activity has been identified.


Figures

Figure 1
Figure 1
(Above) (a) Organization of the murine Blimp-1 gene. The top panel shows a diagram of Blimp-1 cDNA. The coding region is highlighted in light green, exon splice junctions are indicated by dotted red lines and the protein domains by colored blocks. The predicted poly(A) addition sites in the 3′ UT are indicated with asterisks. The bottom panel shows the location of each exon in the three overlapping phage clones, φ21, φ25 and φ17. (Opposite) (b) Comparison of amino acid sequences of Blimp-1 homologs from mouse (accession no. NP031574), human (accession no. NP001189), frog (accession no. AAF08791), fly (accession no. AAF50759), worm (accession no. T21336) and sea urchin (accession no. AAF30407). From the lineup, consensus sequence was derived (not shown). Amino acids identical to the derived consensus sequence are shown in green, amino acids with conservative change are shown in blue and semi-conservative changes in orange. The functional domains in Blimp-1 protein are indicated. Exon junctions in mouse Blimp-1 protein are indicated by red triangles.
Figure 1
Figure 1
(Above) (a) Organization of the murine Blimp-1 gene. The top panel shows a diagram of Blimp-1 cDNA. The coding region is highlighted in light green, exon splice junctions are indicated by dotted red lines and the protein domains by colored blocks. The predicted poly(A) addition sites in the 3′ UT are indicated with asterisks. The bottom panel shows the location of each exon in the three overlapping phage clones, φ21, φ25 and φ17. (Opposite) (b) Comparison of amino acid sequences of Blimp-1 homologs from mouse (accession no. NP031574), human (accession no. NP001189), frog (accession no. AAF08791), fly (accession no. AAF50759), worm (accession no. T21336) and sea urchin (accession no. AAF30407). From the lineup, consensus sequence was derived (not shown). Amino acids identical to the derived consensus sequence are shown in green, amino acids with conservative change are shown in blue and semi-conservative changes in orange. The functional domains in Blimp-1 protein are indicated. Exon junctions in mouse Blimp-1 protein are indicated by red triangles.
Figure 2
Figure 2
Mapping transcription initiation site(s) on the Blimp-1 gene. (a) Rationale for the primer extension and RNase protection assays. The primer for primer extension is specific to nucleotides 21–50 of cloned cDNA. The riboprobe template was Blimp-1 genomic DNA encompassing the putative transcription initiation sites mapped by primer extension. (b) Primer extension assay. The first four lanes are a sequence ladder and the next lane size markers. The last two lanes show extension products derived from total RNA from plasmacytoma P3X or from control tRNA. The arrows indicate the putative transcription initiation sites on the Blimp-1 sequence. (c) RNase protection assay. The two major protected fragments are indicated by arrows. The sizes of RNA markers are indicated. (d) The sequence of transcription initiation sites. The sites mapped by primer extension assay are indicated by dots. The sites mapped by RNase protection assay are indicated by capital letters of the nucleotide sequence. The 5′-most transcription initiation site is assigned the +1 position. The initiator element likely to be responsible for Blimp-1 transcription initiation is underlined.
Figure 2
Figure 2
Mapping transcription initiation site(s) on the Blimp-1 gene. (a) Rationale for the primer extension and RNase protection assays. The primer for primer extension is specific to nucleotides 21–50 of cloned cDNA. The riboprobe template was Blimp-1 genomic DNA encompassing the putative transcription initiation sites mapped by primer extension. (b) Primer extension assay. The first four lanes are a sequence ladder and the next lane size markers. The last two lanes show extension products derived from total RNA from plasmacytoma P3X or from control tRNA. The arrows indicate the putative transcription initiation sites on the Blimp-1 sequence. (c) RNase protection assay. The two major protected fragments are indicated by arrows. The sizes of RNA markers are indicated. (d) The sequence of transcription initiation sites. The sites mapped by primer extension assay are indicated by dots. The sites mapped by RNase protection assay are indicated by capital letters of the nucleotide sequence. The 5′-most transcription initiation site is assigned the +1 position. The initiator element likely to be responsible for Blimp-1 transcription initiation is underlined.
Figure 3
Figure 3
Alternative polyadenylation and alternative splicing of Blimp-1 mRNA. (a) Northern blot analysis of Blimp-1 mRNAs. The diagram indicates portions of cDNA used as probes. Probes specific for the 5′ UT and the coding region were derived from either cDNA or genomic phage clones and are exon-specific. Probes derived from 3′ UT were derived from the cDNA. The asterisks in the diagram denote the putative poly(A) sites conserved between mouse and human Blimp-1 gene. The size of mRNA [without poly(A) tail] expected from the usage of each poly(A) site is indicated. (b) RT–PCR analysis of Blimp-1 mRNA. The diagram shows the possible alternative splicing involving exon 7 and the rationale for the PCR primers design. The expected sizes of the PCR products from the cloned cDNA and the potential Δexon7 isoform are indicated. The PCR products from each pair of primers were separated on 5% PAGE. +/– RT indicate the PCR products of cDNA synthesized in the presence or absence of AMV–RT respectively. (c) cDNA sequence and deduced amino acid sequence of the zinc finger domain of Δexon7 Blimp-1 isoform. The arrow indicates the exon splice junction.
Figure 3
Figure 3
Alternative polyadenylation and alternative splicing of Blimp-1 mRNA. (a) Northern blot analysis of Blimp-1 mRNAs. The diagram indicates portions of cDNA used as probes. Probes specific for the 5′ UT and the coding region were derived from either cDNA or genomic phage clones and are exon-specific. Probes derived from 3′ UT were derived from the cDNA. The asterisks in the diagram denote the putative poly(A) sites conserved between mouse and human Blimp-1 gene. The size of mRNA [without poly(A) tail] expected from the usage of each poly(A) site is indicated. (b) RT–PCR analysis of Blimp-1 mRNA. The diagram shows the possible alternative splicing involving exon 7 and the rationale for the PCR primers design. The expected sizes of the PCR products from the cloned cDNA and the potential Δexon7 isoform are indicated. The PCR products from each pair of primers were separated on 5% PAGE. +/– RT indicate the PCR products of cDNA synthesized in the presence or absence of AMV–RT respectively. (c) cDNA sequence and deduced amino acid sequence of the zinc finger domain of Δexon7 Blimp-1 isoform. The arrow indicates the exon splice junction.
Figure 4
Figure 4
Polymerase loading on the Blimp-1 gene in B cell lines. Nuclear run-on assay showing the transcription of Cµ, Blimp-1, GAPDH and c-myc genes in nuclei from plasmacytoma (P3X) and pre-B (18-81) cells. pUC19 DNA was used as negative control. The amount of each transcript was quantified using a PhosphoImager and corrected for uridine content. The relative amount of each transcript, compared to c-myc, is shown.
Figure 5
Figure 5
Identification of the Blimp-1 basal promoter. Transient transfection of a luciferase reporter dependent upon the Blimp-1 gene from –918 to +207 bp. (GenBank accession no. AF305534) in cell lines: P3X, 18-81, NIH 3T3 and U937. P denotes the reporter containing the promoter region; V denotes the parental reporter. The data were corrected for the transfection efficiency using Renilla luciferase and the mean ± standard deviation of triplicate data points is shown.

Similar articles

Cited by

References

    1. Lamson G. and Koshland,M.E. (1984) Changes in J chain and mu chain RNA expression as a function of B cell differentiation. J. Exp. Med., 160, 877–892. - PMC - PubMed
    1. Krenacs L., Himmelmann,A.W., Quintanilla-Martinez,L., Fest,T., Riva,A., Wellmann,A., Bagdi,E., Kehrl,J.H., Jaffe,E.S. and Raffeld,M. (1998) Transcription factor B-cell-specific activator protein (BSAP) is differentially expressed in B cells and in subsets of B-cell lymphomas. Blood, 92, 1308–1316. - PubMed
    1. Oliver A.M., Martin,F. and Kearney,J.F. (1997) Mouse CD38 is down-regulated on germinal center B cells and mature plasma cells. J. Immunol., 158, 1108–1115. - PubMed
    1. Sanderson R.D., Lalor,P. and Bernfield,M. (1989) B lymphocytes express and lose syndecan at specific stages of differentiation. Cell Regul., 1, 27–35. - PMC - PubMed
    1. Turner C.A. Jr, Mack,D.H. and Davis,M.M. (1994) Blimp-1, a novel zinc finger-containing protein that can drive the maturation of B lymphocytes into immunoglobulin-secreting cells. Cell, 77, 297–306. - PubMed

Publication types

MeSH terms