. 2000 Dec;101(4):501-11.
doi: 10.1046/j.1365-2567.2000.00143.x.

A critical role for alveolar macrophages in elicitation of pulmonary immune fibrosis

Affiliations

A critical role for alveolar macrophages in elicitation of pulmonary immune fibrosis

J Zhang-Hoover et al. Immunology. 2000 Dec.

Abstract

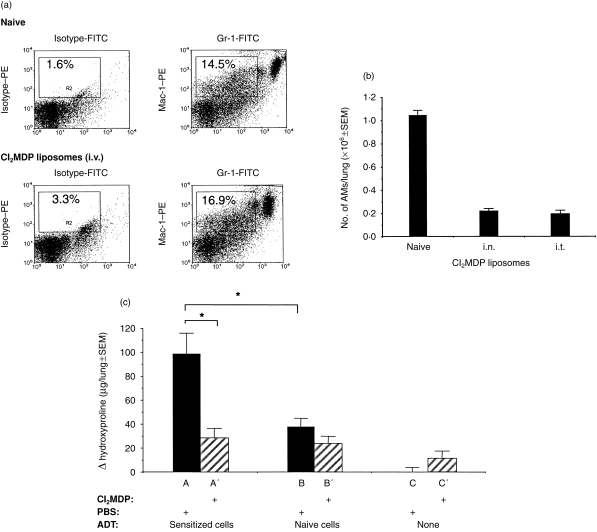
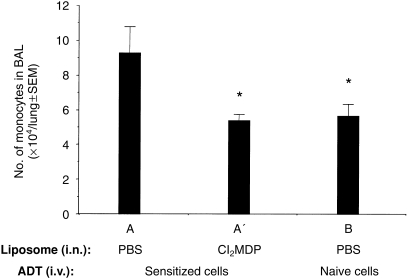
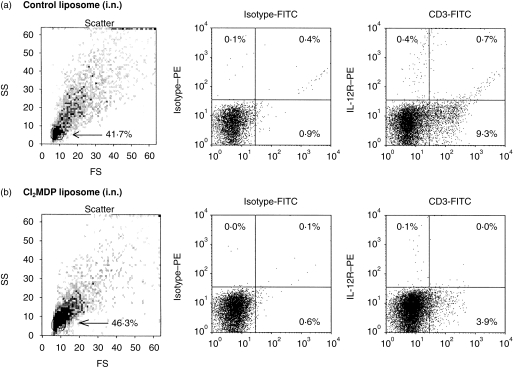
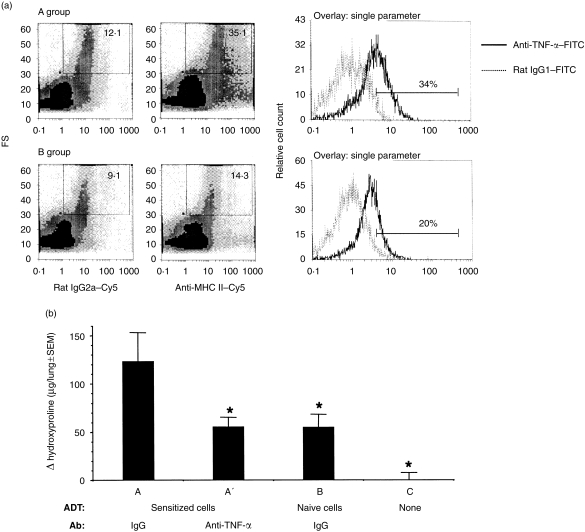
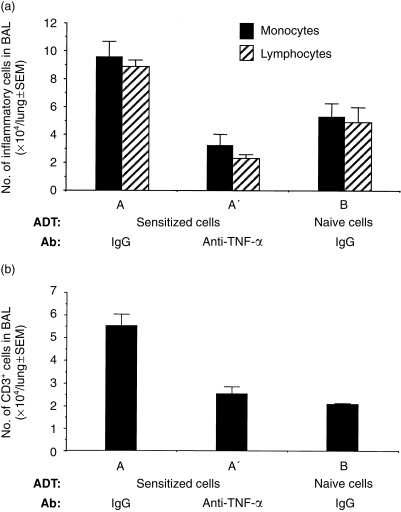
Hapten immune pulmonary interstitial fibrosis (HIPIF) is induced by a recall cell-mediated immune response against the hapten 2,4, 6-trinitrobenzene sulphonic acid (TNBS) in the lung. Studies here dissect the role of the cellular components of the bronchoalveolar lavage (BAL) cells (alveolar macrophages [AMs] versus monocytes and immature dendritic cells) in the fibrogenic inflammatory response. BAL cells from HIPIF mice were generally more activated and produced a greater amount of tumour necrosis factor-alpha (TNF-alpha) than controls. Liposome-encapsulated dichloromethylene diphosphonate (Cl(2)MDP) that was inoculated intranasally (i.n.) into mice selectively depleted AMs. Following AM depletion, the number of TNF-alpha-containing cells was reduced, and both the number of immune inflammatory cells recruited into the alveolar space and the subsequent collagen deposition (hydroxyproline) were decreased in the sensitized and intratracheally (i.t.) challenged mice. In conclusion, AMs are required, in part, for the development of pulmonary fibrosis in HIPIF because AM-derived factors such as TNF-alpha are needed for initiation of chemokine and cytokine pathways and accumulation of immune inflammatory cells.


Figures

Figure 1
Figure 1
(a) Flow cytometric analysis of the Mac-1+/Gr-1dim population in peripheral blood after intravenous (i.v.) treatment with dichloromethylene diphosphonate (Cl2MDP) liposomes. The two-parameter histograms compare the percentage of Mac-1+/Gr-1dim cells in peripheral blood from naïve mice that were treated with or without Cl2MDP liposomes (i.v., 200 µl/mouse). The blood was collected 2 days after the treatment and stained with phycoerythrin (PE)-conjugated Mac-1 antibody and biotin-conjugated Gr-1 antibody plus fluorescein isothiocyanate (FITC)-conjugated ExtrAvidin®. The samples were analysed using flow cytometry. Peripheral blood monocytes were identified by their Mac-1+/Gr-1dim staining pattern and gated on the histograms. The percentage of Mac-1+/Gr-1dim cells is indicted in each gate by the rectangle. (b) Differential cell counts of alveolar macrophages (AM) in bronchoalveolar lavage (BAL) following intranasal (i.n.) or intratracheal (i.t.) Cl2MDP liposome treatment. The histogram shows the number of AMs in each lung (ordinate) after the naïve mice were treated or not treated with Cl2MDP liposomes (abscissa). One dose of 100 µl of Cl2MDP liposomes was given i.t. per naïve mouse. Three doses of 33 µl (total 99 µl) of Cl2MDP liposomes were given i.n. per naïve mouse during the course of 1 day. BAL was collected 2 days after i.t. or i.n. treatment. BAL cytospins were stained with Wright–Giemsa and evaluated by light microscopy (×40 Nikon). Three mice were used in each group. AMs were identified and counted by differential cell counts (see the Materials and Methods). The number of AMs in each lung was calculated by multiplying the total number of cells in the BAL preparation with the percentage of AMs from differential cell counts. The result is presented as mean±SEM. (c) Hydroxyproline deposition in the lungs of adoptive transfer-hapten immune pulmonary interstitial fibrosis (ADT-HIPIF) mice treated with Cl2MDP liposomes (i.n.). Recipient mice (groups A′, B′ and C′) were treated with Cl2MDP liposomes (33 µl/dose×three doses) and irradiated 1 day prior to receiving adoptive transfer of sensitized or non-sensitized cells. The mice in groups A, B and C were treated with phosphate-buffered saline (PBS) liposomes. One day before i.t. challenge, the mice in groups A and A′ received 3×10⁷ 2,4,6-trinitrobenzene sulphonic acid (TNBS)-sensitized spleen and draining lymph node (inguinal, brachial, axillary) cells; mice in groups B and B′ received 3×10⁷ naïve spleen cells, and lymph node (inguinal, brachial, axillary) cells. Group C mice were untreated. Fourteen days after i.t. challenge, the lungs from experimental mice (five mice per group) were harvested and analysed for their hydroxyproline level. The histogram shows the change (Δ) in hydroxyproline level (experimental hydroxyproline – baseline hydroxyproline) in each experimental group (mean±SEM). The baseline hydroxyproline concentration was 20 µg/lung and was calculated as the mean hydroxyproline concentration from five naïve mice that were treated with PBS liposomes (i.n.). An asterisk (*) indicates a statistically significant difference (P=0·05) between indicated groups. The experiment was repeated twice.
Figure 2
Figure 2
Infiltrating monocyte/immature dendritic cell counts in the bronchoalveolar lavage (BAL) of adoptive transfer-hapten immune pulmonary interstitial fibrosis (ADT-HIPIF) mice treated with dichloromethylene diphosphonate (Cl2MDP) liposomes intranasally (i.n.). Cl2MDP liposomes were given i.n. to recipient mice 2 days prior to intratracheal (i.t.) challenge (see the legend to Fig. 1c). BAL was collected from experimental mouse groups (A, A′ and B) 2 days after i.t. challenge with 2,4,6-trinitrobenzene sulphonic acid (TNBS). Differential cell counts were performed using light microscopy (×100 under oil) and an eye piece grid. One thousand cells were counted per slide per animal, and four slides per group (n = 4). Monocytes were distinguished from other cells as described in the Materials and Methods. The number of infiltrating monocytes/immature dendritic cells was calculated and is presented as mean ±SEM. An asterisk (*) indicates a statistically significant difference (P≤0·05) between the indicated group and group A. The experiment was repeated twice.
Figure 3
Figure 3
Reverse transcription–polymerase chain reaction (RT–PCR) analyses and densitometry measurements of the mRNA level of interleukin-12 (IL-12) β1 and β2 subunits in bronchoalveolar lavage (BAL) cells from adoptive transfer-hapten immune pulmonary interstitial fibrosis (ADT-HIPIF) mice treated with dichloromethylene diphosphonate (Cl2MDP) liposomes. (a) BAL was collected 2 days after intratracheal (i.t.) challenge from group A mice (skin sensitized and i.t. challenged) and group B mice (i.t. challenged only). (b) The recipient mice were treated with Cl2MDP liposomes (A′, 33 µl/dose×three doses/mouse) or control phosphate-buffered saline (PBS) liposomes (A) two days prior to i.t. challenge. BAL was collected 1 day after i.t. challenge. Total RNA was purified and RT–PCR was performed using IL-12Rβ1- and -β2-specific primer sets. The PCR product was separated on a 1% agarose gel and visualized by using GelStar® nucleic acid gel stain and UV illumination, as shown on the left side of each panel. The histograms on the right side of each panel show the density of the bands measured using Gel Doc 2000. The relative density of β1 (532 bp) and β2 (399 bp) bands was normalized to β-actin (540 bp). The experiment was repeated three times.
Figure 4
Figure 4
Flow cytometric dot-plot analyses of CD3+ and interleukin-12 receptor-positive (IL-12R+) lymphocytes in adoptive transfer-hapten immune pulmonary interstitial fibrosis (ADT-HIPIF) lungs treated with dichloromethylene diphosphonate (Cl2MDP) liposomes intranasally (i.n.). Recipient mice were treated i.n. with Cl2MDP liposomes (33 µl/dose×three doses) or control liposomes 2 days prior to i.t. challenge and received sensitized cells 1 day before i.t. challenge. One day after i.t. challenge, bronchoalveolar lavage (BAL) was collected, stained for surface expression of CD3 and IL-12R (see Materials and methods) and then analysed using flow cytometry. (a) Mice were treated with control liposomes. (b) Mice were treated with Cl2MDP liposomes. The percentage of the population that was gated (arrow) is indicated in the forward scatter (FS)/side scatter (SS) dot-plot in (a) and (b) of each panel. To the right of each panel are dot-plots showing CD3 and IL-12R expression on gated cells. The percentage of CD3+ and IL-12R+ cells is indicated in each quadrant. A minimum of three mice was used in each experimental group. The experiment was repeated twice. FITC, fluorescein isothiocyanate.
Figure 5
Figure 5
(a) Flow cytometric analysis of intracellular tumour necrosis factor-α (TNF-α) in hapten immune pulmonary interstitial fibrosis (HIPIF) alveolar macrophages (AMs). Histograms show the intracellular staining of TNF-α in AMs from mice that were skin sensitized and challenged intratracheally (i.t.) with 2,4,6-trinitrobenzene sulphonic acid (TNBS) (HIPIF mice, group A) or from mice that were challenged i.t. only (group B). Three days after i.t. challenge, bronchoalveolar lavage (BAL) was collected. BAL cells were pooled from three experimental mice in each group and surface markers and intracellular proteins were stained with biotin-conjugated anti-major histocompatibility complex (MHC) II plus streptavidin Cy-Chrome® (Cy5) and fluorescein isothiocyanate (FITC)-conjugated anti-TNF-α antibodies, respectively. The group A and B dot-plots show gated cells (rectangle) that were selected as AMs because of their large size and expression of MHC IIdim. The mean fluorescence intensity of MHC II staining is indicated in each dot-plot. The expression of TNF-α in the gated cells was analysed and is presented as percentage (%) of positive cells. The experiment was repeated three times. FS, forward scatter. (b) Hydroxyproline deposition in the lungs of adoptive transfer (ADT)-HIPIF mice treated with TNF-α-neutralizing antibody. The level of hydroxyproline in the lung was compared among experimental groups (A, A′, B and C). The treatment of recipient mice is described under the abscissa: ADT, adoptive transfer of donor cells (TNBS-sensitized or naïve); Ab, antibody treatment. The donor cells (3×10⁷/mouse) were transferred to the recipient mice 1 day before i.t. challenge. TNF-α-neutralizing antibody (50 000 units/mouse) or control immunoglobulin G (IgG) was given intraperitoneally (i.p.) 2 days before i.t. challenge and 2 hours after i.t. challenge (intranasally). Fourteen days after i.t. challenge, lungs were harvested and a hydroxyproline assay was performed. The histogram shows the change (Δ) in hydroxyproline level (experimental hydroxyproline – baseline hydroxyproline) in each experimental group (mean±SEM). The baseline hydroxyproline concentration was the mean hydroxyproline level of four naïve mice and was 180·3 µg per lung. An asterisk (*) indicates a significant difference between the indicated group and group A.
Figure 6
Figure 6
Cell counts of infiltrating inflammatory cells in the bronchoalveolar lavage (BAL) of adoptive transfer-hapten immune pulmonary interstitial fibrosis (ADT-HIPIF) mice treated with tumour necrosis factor-α (TNF-α)-neutralizing antibody. Blinded differential counts were performed on Wright–Giemsa-stained BAL cytospins. (a) The bar graph shows the mean number (±SEM) of infiltrating lymphocytes and monocytes/immature dendritic cells in the BAL (ordinate) of experimental mice (groups A, A′ and B [abscissa]) 3 days after intratracheal (i.t.) challenge with 2,4,6-trinitrobenzene sulphonic acid (TNBS). The T cells in the BAL samples were identified by flow cytometry of fluorescein isothiocyanate (FITC)-labelled CD3+ BAL cells. (b) The bar graph shows the mean number of CD3+ T cells in the BAL of experimental mice (A, A′ and B) 3 days after i.t. challenge. Five mice were used in each experimental group. An asterisk (*) indicates a statistically significant difference (P≤0·05) between groups A and A′ or groups A and B.

References

    1. Weltzien HU, Moulon C, Marin C, Padovan S, Harmann U, Kohler J. T cell immune response to haptens. Structural models for allergic and autoimmune reactions. Toxicology. 1996;107:141–51. 10.1016/0300-483x(95)03253-c. - DOI - PubMed
    1. Kalish RS, Wood JA. Induction of hapten-specific tolerance of human CD8+ urushiol (poison ivy)-reactive T lymphocytes. J Invest Dermatol. 1997;108:253–7. - PubMed
    1. Gelber C, Gemmell L, McAteer D, et al. Down-regulation of poison ivy/oak-induced contact sensitivity by treatment with a class II MHC binding peptide–hapten conjugate. J Immunol. 1997;158:2425–35. - PubMed
    1. Padovan E, von Greyerz S, Pichler WJ, Weltzien HU. Antigen-dependent and -independent IFN-gamma modulation by penicillins. J Immunol. 1999;162:1171–7. - PubMed
    1. Coleman JW. Protein haptenation by drugs. Clin Exp Allergy. 1998;28:79–82. - PubMed

LinkOut - more resources