Comparative Study
. 2001 Jan;85(1):74-9.
doi: 10.1136/bjo.85.1.74.

Computer algorithms for the automated measurement of retinal arteriolar diameters

Affiliations
Comparative Study

Computer algorithms for the automated measurement of retinal arteriolar diameters

N Chapman et al. Br J Ophthalmol. 2001 Jan.

Abstract

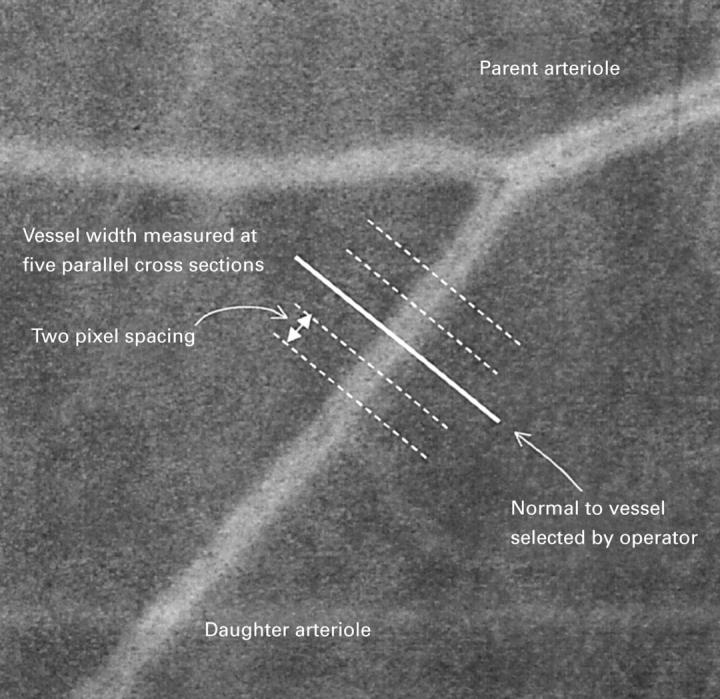
Aims: Quantification of retinal vascular change is difficult and manual measurements of vascular features are slow and subject to observer bias. These problems may be overcome using computer algorithms. Three automated methods and a manual method for measurement of arteriolar diameters from digitised red-free retinal photographs were compared.

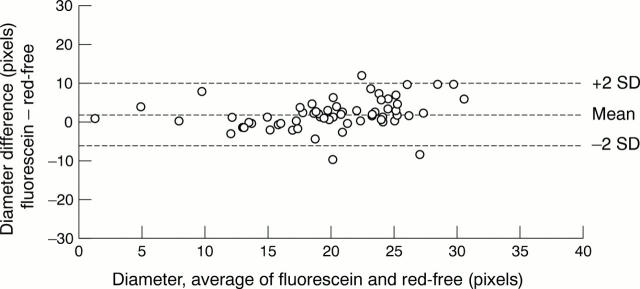
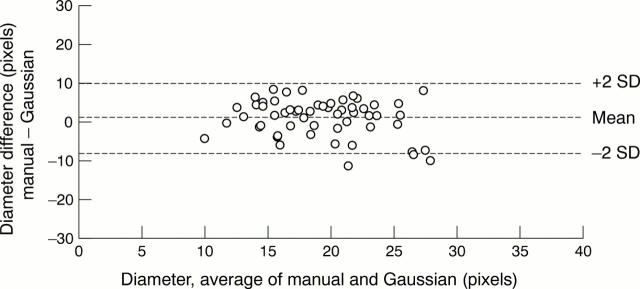
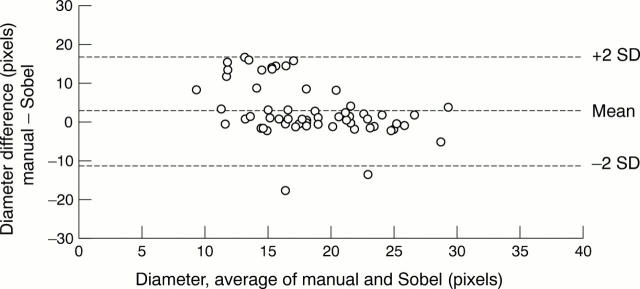
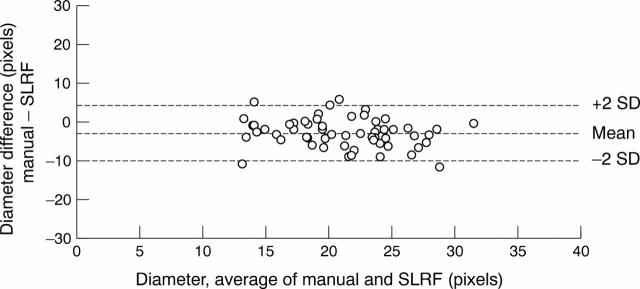
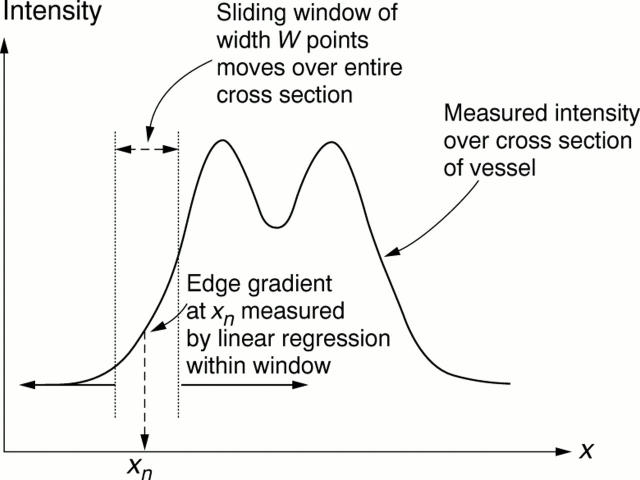
Methods: 60 diameters (in pixels) measured by manual identification of vessel edges in red-free retinal images were compared with diameters measured by (1) fitting vessel intensity profiles to a double Gaussian function by non-linear regression, (2) a standard edge detection algorithm (Sobel), and (3) determination of points of maximum intensity variation by a sliding linear regression filter (SLRF). Method agreement was analysed using Bland-Altman plots and the repeatability of each method was assessed.

Results: Diameter estimations obtained using the SLRF method were the least scattered although diameters obtained were approximately 3 pixels greater than those measured manually. The SLRF method was the most repeatable and the Gaussian method less so. The Sobel method was the least consistent owing to frequent misinterpretation of the light reflex as the vessel edge.

Conclusion: Of the three automated methods compared, the SLRF method was the most consistent (defined as the method producing diameter estimations with the least scatter) and the most repeatable in measurements of retinal arteriolar diameter. Application of automated methods of retinal vascular analysis may be useful in the assessment of cardiovascular and other diseases.


Figures

Figure 1
Figure 1
Image showing a retinal arteriolar bifurcation. To measure vessel diameters using operator dependent automated techniques a line is drawn perpendicular to the arteriole (bold line). A total of five measurements are made along parallel lines drawn with 2 pixel spacing between each measurement using the algorithms described (not drawn to scale).
Figure 2
Figure 2
Bland-Altman plot of differences between median manual diameter measurements from fluorescein angiograms and red-free images, plotted against the average of the two measurements. Broken lines represent the mean difference (2 SD) of the difference (95% limits of agreement).
Figure 3
Figure 3
Bland-Altman plots of differences between median manual and median Gaussian diameter measurements, plotted against the average of the two measurements. Measurements were made from the same red-free image. Broken lines represent the mean difference (2 SD) of the difference.
Figure 4
Figure 4
Bland-Altman plots of differences between median manual and median Sobel diameter measurements, plotted against the average of the two measurements. Measurements were made from the same red-free image. Broken lines represent the mean difference (2 SD) of the difference.
Figure 5
Figure 5
Bland-Altman plots of differences between median manual and median SLRF diameter measurements, plotted against the average of the two measurements. Measurements were made from the same red-free image. Broken lines represent the mean difference (2 SD) of the difference.
Figure 6
Figure 6
The sliding linear regression filter (SLRF) method is applied to a vessel cross section as illustrated. The width of the sliding window (W) is determined by a moment calculation and the window is progressively moved across the width of the vessel. At each position of the window, the gradient of intensity change with distance is measured by a linear regression calculation.

Similar articles

Cited by

References

    1. Science. 1962 Aug 24;137(3530):577-85 - PubMed
    1. Ophthalmology. 1982 Oct;89(10):1127-31 - PubMed
    1. Invest Ophthalmol Vis Sci. 1993 Jul;34(8):2576-80 - PubMed
    1. J Hypertens. 1995 Dec;13(12 Pt 2):1724-8 - PubMed
    1. Lancet. 1989 May 20;1(8647):1103-6 - PubMed

Publication types