. 2000 Dec 25;151(7):1449-58.
doi: 10.1083/jcb.151.7.1449.

Temporal and spatial distribution of activated Pak1 in fibroblasts

Affiliations

Temporal and spatial distribution of activated Pak1 in fibroblasts

M A Sells et al. J Cell Biol. .

Abstract

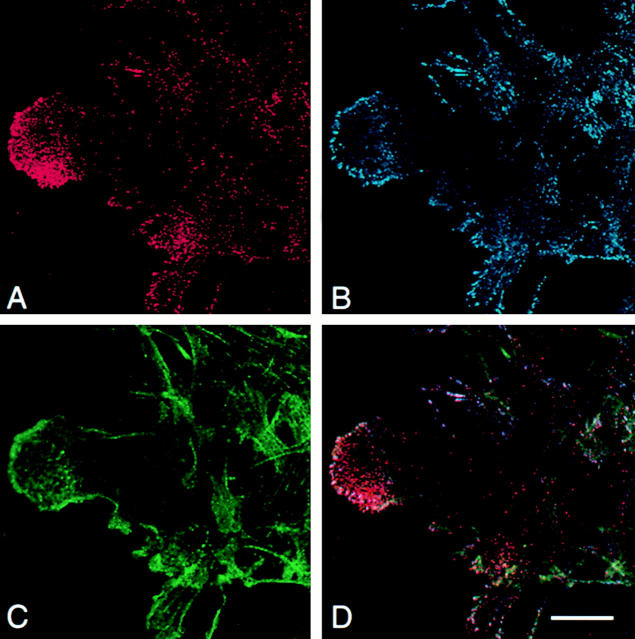
p21-activated kinases (Paks) are effectors of the small GTPases Cdc42 and Rac, and are thought to mediate some of the cytoskeletal and transcriptional activities of these proteins. To localize activated Pak1 in cells, we developed an antibody directed against a phosphopeptide that is contained within the activation loop of Pak1. This antibody specifically recognizes the activated form of Pak1. Immunofluorescence analysis of NIH-3T3 cells coexpressing activated Cdc42 or Rac1 plus wild-type Pak1 shows that activated Pak1 accumulates at sites of focal adhesion, throughout filopodia and within the body and edges of lamellipodia. Platelet-derived growth factor stimulation of NIH-3T3 cells shows a pattern of Pak1 activation similar to that observed with Rac1. During closure of a fibroblast monolayer wound, Pak1 is rapidly activated and localizes to the leading edge of motile cells, then gradually tapers off as the wound closes. The activation of Pak1 by wounding is blocked by inhibitors of phosphatidylinositol 3-kinase, and Src family kinases, but not by an inhibitor of the epidermal growth factor receptor. These findings indicate that activated Pak1, and by extension, probably activated Cdc42 or Rac, accumulates at sites of cortical actin remodeling in motile fibroblasts.


Figures

Figure 1
Figure 1
Antiphospho-Pak1 antibody specifically recognizes activated Pak1. (A) Activation loop sequence of the phosphorylated peptide used for production of polyclonal antiphospho-Pak1 antisera. (B) Immunoblots (lanes 1–4) and radiolabeled kinase reaction products (lanes 5 and 6) of baculovirus-produced Pak1. Purified KD or CA Pak1 was incubated in protein kinase buffer in the presence of ATP, then immunoblotted using anti-Pak1 (lanes 1 and 2) and antiphospho-Pak antisera (lanes 3 and 4) autoradiographed to detect antibody-bound proteins. Although both forms of the protein were detected with anti-Pak1, only activated Pak1 was detected using the phospho-specific antibody, despite the large amount of recombinant protein used in this assay. Lanes 5 and 6 show autoradiographed PAGE gel of reaction products from a kinase assay performed in the presence of [γ-32P]ATP. Molecular mass in kilodaltons is shown to the right of the blot. (C) Comparison between immunoblot and radiolabeled kinase reaction products of Pak1 activated by Cdc42. Purified baculovirally produced Pak1 was incubated with or without activated Cdc42, as indicated. The kinase was then incubated in protein kinase buffer, containing histone 4 as substrate, in the presence of [γ-32P]ATP. An immunoblot and autoradiogram are shown. (D) Sensitivity of antiphospho-Pak sera. 20–100 ng of KD and CA Pak1 were probed with both anti-Pak1 and antiphospho-Pak.
Figure 2
Figure 2
Cross-reactivity with Pak-related kinases. (A) Comparison of activation loop sequences in Pak1 and Mst2. (B) Purified, autophosphorylated recombinant Pak1 and Mst2 were assayed and probed as in the legend to Fig. 1.
Figure 4
Figure 4
Localization of GTPase-activated Pak1 in fibroblasts. Tetracycline-regulated NIH-3T3 cell lines that inducibly express Pak1 (A, D, and G), as well as cells that inducibly express wild-type Pak1 plus activated Rac1 (B, E, and H) or activated Cdc42 (C, F, and I), were used to determine the subcellular location of activated Pak1. (A–C) Antiphospho-Pak1 staining (red); (D–F) merged phalloidin (green) and antiphospho-Pak1 (red) and GTPase (blue). Colocalization of phospho-Pak1 and Cdc42 or Rac1 produces white-yellow; (G–I) pseudocolored sagittal scans of these Z scanned images. Red, high intensity fluorescence; yellow, medium intensity fluorescence; and blue, low intensity fluorescence. Bars, 25 μm.
Figure 3
Figure 3
Antiphospho-Pak sera detects activated Pak1 in cell lysates. (A) COS1 cells were transfected with wild-type Pak1 alone (lanes 1, 3, and 5), or wild-type Pak1 plus activated Cdc42 (lane 2), Rac1 (lane 4), or RhoA (lane 6). Lysates were probed with anti-Myc (to detect exogenous Pak1), antiphospho-Pak, and anti-HA (to detect the GTPases). (B) COS1 cells were cotransfected with wild-type Pak1 in combination with wild-type (WT) (lane 1) or activated (L61) Cdc42 (lane 2). An immunoblot of cell lysates was probed with antiphospho-Pak.
Figure 5
Figure 5
Activation of Pak1 by PDGF. (A) A tetracycline-regulated NIH-3T3 cell line expressing wild-type Pak1 was treated with PDGF. At the indicated times, the cells were lysed and analyzed by immunoblot using antiphospho-Pak antisera. The blot is representative of results obtained from three independent experiments. (B) The cells were treated for 5 min with vehicle alone (A–D) or 30 ng/nl PDGF (E–H), then fixed and stained for actin (A and E), phospho-Pak (B and F), and Pak1 (C and G). These confocal images were then merged (D and H). Bar, 25 μm.
Figure 5
Figure 5
Activation of Pak1 by PDGF. (A) A tetracycline-regulated NIH-3T3 cell line expressing wild-type Pak1 was treated with PDGF. At the indicated times, the cells were lysed and analyzed by immunoblot using antiphospho-Pak antisera. The blot is representative of results obtained from three independent experiments. (B) The cells were treated for 5 min with vehicle alone (A–D) or 30 ng/nl PDGF (E–H), then fixed and stained for actin (A and E), phospho-Pak (B and F), and Pak1 (C and G). These confocal images were then merged (D and H). Bar, 25 μm.
Figure 6
Figure 6
Temporal sequence of Pak1 activation in wounded fibroblasts. (A) Confluent monolayers of wild-type Pak1 expressing NIH-3T3 S2-6 cells were wounded by scraping away a 200–250-μm row of cells, then stained for phospho-Pak and F-actin at defined intervals (0–120 min) (not shown). A marked increase in activated Pak1 is seen within 5 min of wounding. Activated Pak1 is most concentrated in cells at the edges of the monolayer wounds. The highest intracellular levels are within lamellipodia (arrowhead), filopodia (arrows), and focal adhesions. Images were captured using cooled CCD with Isee™ software. (B) Time course of Pak1 activation as assessed by immunoblot. The assay was repeated three times with similar results. (C) Quantitation of phospho-Pak1 levels, as assessed by densitometric scanning of immunoblots. At least four uninduced samples were scanned per time point. Standard error was calculated for all samples. Bar, 200 μm.
Figure 6
Figure 6
Temporal sequence of Pak1 activation in wounded fibroblasts. (A) Confluent monolayers of wild-type Pak1 expressing NIH-3T3 S2-6 cells were wounded by scraping away a 200–250-μm row of cells, then stained for phospho-Pak and F-actin at defined intervals (0–120 min) (not shown). A marked increase in activated Pak1 is seen within 5 min of wounding. Activated Pak1 is most concentrated in cells at the edges of the monolayer wounds. The highest intracellular levels are within lamellipodia (arrowhead), filopodia (arrows), and focal adhesions. Images were captured using cooled CCD with Isee™ software. (B) Time course of Pak1 activation as assessed by immunoblot. The assay was repeated three times with similar results. (C) Quantitation of phospho-Pak1 levels, as assessed by densitometric scanning of immunoblots. At least four uninduced samples were scanned per time point. Standard error was calculated for all samples. Bar, 200 μm.
Figure 7
Figure 7
Colocalization of activated Pak1 and paxillin at the leading edge of motile fibroblasts. A monolayer of wild-type Pak1 expressing NIH-3T3 S2-6 cells were wounded as in the legend to Fig. 6. The leading edge of the wounded monolayer is depicted. Cells were stained with (A) antiphospho-Pak1 (red); (B) antipaxillin (blue); and (C) phalloidin (green). A merged image (D) is also shown. Bar, 25 μm.
Figure 8
Figure 8
Signaling pathways required for Pak1 activation by wounding. Monolayers of wild-type Pak1 expressing NIH-3T3 S2-6 cells were pretreated for 10 min with the indicated compounds, then wounded as in the legend to Fig. 6. (A) 15 min after wounding, the cells were lysed and immunoblotted with antiphospho-Pak. All assays were carried out in triplicate. (B) These data were also quantified by PhosphorImager (Fuji) analysis. LY, LY294002; TP, tyrphostin AG1478.

References

    1. Bagrodia S., Cerione R.A. PAK to the future. Trends Cell Biol. 1999;9:350–355. - PubMed
    1. Bagrodia S., Taylor S., Creasy C.L., Chernoff J., Cerione R.A. Identification of a murine p21Cdc42/Rac activated protein kinase (PAK) J. Biol. Chem. 1995;270:22731–22738. - PubMed
    1. Bailly M., Macaluso F., Cammer M., Chan A., Segall J.E., Condeelis J.S. Relationship between Arp2/3 complex and the barbed ends of actin filaments at the leading edge of carcinoma cells after epidermal growth factor stimulation. J. Cell Biol. 1999;145:331–345. - PMC - PubMed
    1. Bokoch G.M., Wang Y., Bohl B.P., Sells M.A., Quilliam L.A., Knaus U.G. Interaction of Nck adapter protein with p21-activated kinase (PAK1) J. Biol. Chem. 1996;271:25746–25749. - PubMed
    1. Chan A.Y., Raft S., Bailly M., Wyckoff J.B., Segall J.E., Condeelis J.S. EGF stimulates an increase in actin nucleation and filament number at the leading edge of the lamellipod in mammary adenocarcinoma cells. J. Cell Sci. 1998;111:199–211. - PubMed

Publication types

MeSH terms