. 2000 Dec 25;151(7):1549-60.
doi: 10.1083/jcb.151.7.1549.

Activated R-ras, Rac1, PI 3-kinase and PKCepsilon can each restore cell spreading inhibited by isolated integrin beta1 cytoplasmic domains

Affiliations

Activated R-ras, Rac1, PI 3-kinase and PKCepsilon can each restore cell spreading inhibited by isolated integrin beta1 cytoplasmic domains

A L Berrier et al. J Cell Biol. .

Abstract

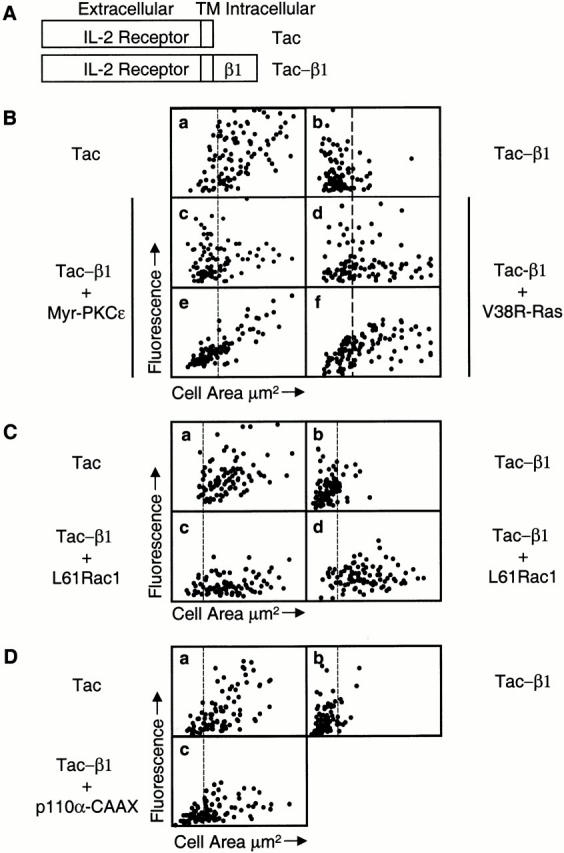
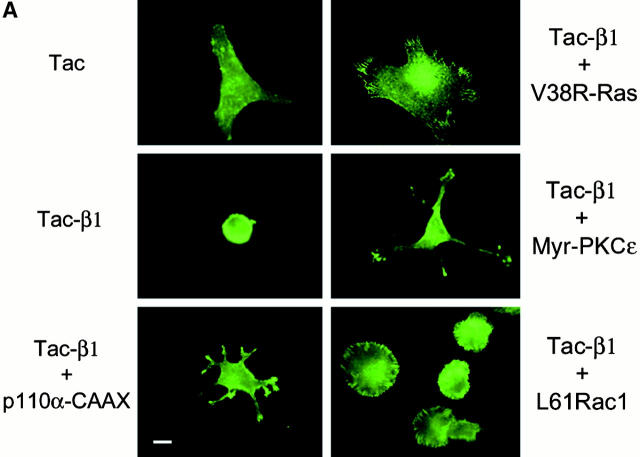
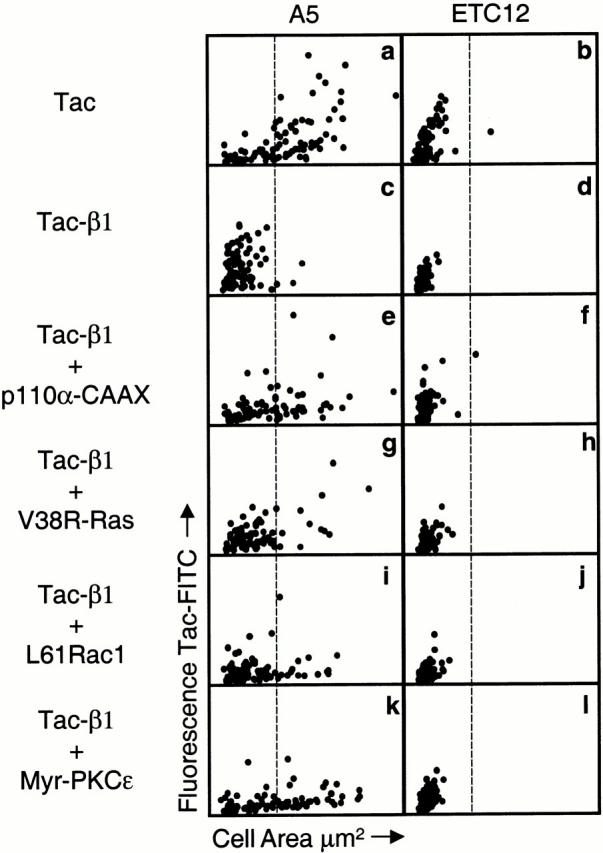
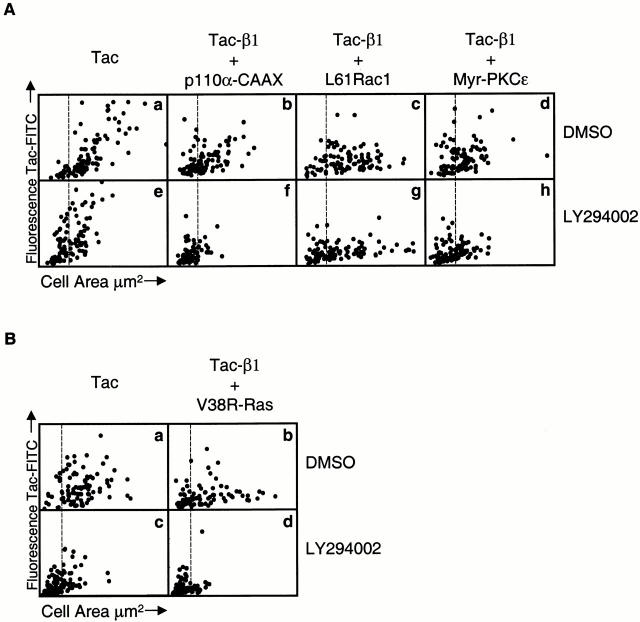
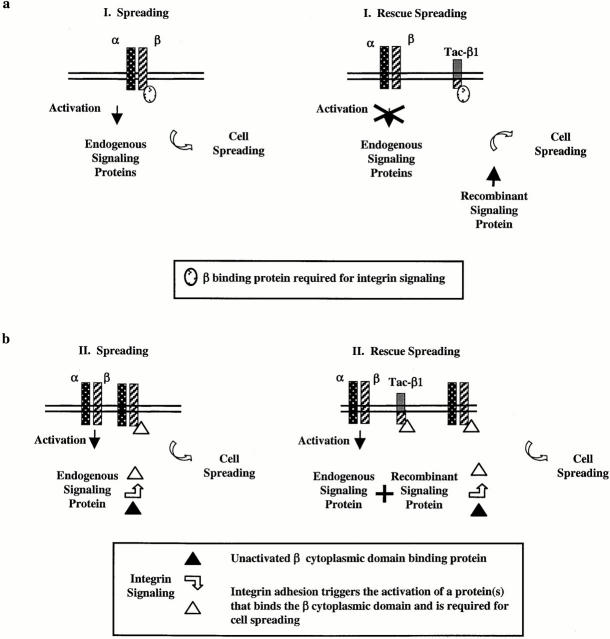
Attachment of many cell types to extracellular matrix proteins triggers cell spreading, a process that strengthens cell adhesion and is a prerequisite for many adhesion-dependent processes including cell migration, survival, and proliferation. Cell spreading requires integrins with intact beta cytoplasmic domains, presumably to connect integrins with the actin cytoskeleton and to activate signaling pathways that promote cell spreading. Several signaling proteins are known to regulate cell spreading, including R-Ras, PI 3-kinase, PKCepsilon and Rac1; however, it is not known whether they do so through a mechanism involving integrin beta cytoplasmic domains. To study the mechanisms whereby cell spreading is regulated by integrin beta cytoplasmic domains, we inhibited cell spreading on collagen I or fibrinogen by expressing tac-beta1, a dominant-negative inhibitor of integrin function, and examined whether cell spreading could be restored by the coexpression of either V38R-Ras, p110alpha-CAAX, myr-PKCepsilon, or L61Rac1. Each of these activated signaling proteins was able to restore cell spreading as assayed by an increase in the area of cells expressing tac-beta1. R-Ras and Rac1 rescued cell spreading in a GTP-dependent manner, whereas PKCstraightepsilon required an intact kinase domain. Importantly, each of these signaling proteins required intact beta cytoplasmic domains on the integrins mediating adhesion in order to restore cell spreading. In addition, the rescue of cell spreading by V38R-Ras was inhibited by LY294002, suggesting that PI 3-kinase activity is required for V38R-Ras to restore cell spreading. In contrast, L61Rac1 and myr-PKCstraightepsilon each increased cell spreading independent of PI 3-kinase activity. Additionally, the dominant-negative mutant of Rac1, N17Rac1, abrogated cell spreading and inhibited the ability of p110alpha-CAAX and myr-PKCstraightepsilon to increase cell spreading. These studies suggest that R-Ras, PI 3-kinase, Rac1 and PKCepsilon require the function of integrin beta cytoplasmic domains to regulate cell spreading and that Rac1 is downstream of PI 3-kinase and PKCepsilon in a pathway involving integrin beta cytoplasmic domain function in cell spreading.


Figures

Figure 1
Figure 1
Coexpression of either myr-PKCε, V38R-Ras, L61Rac1, or p110α-CAAX with tac-β1 can restore cell spreading on collagen I. (A) Diagram of the control tac receptor containing the extracellular and transmembrane domains of the small (tac) subunit of the human interleukin-2 receptor and the tac-β1 chimera containing the same domains of the interleukin-2 receptor fused to the human integrin β1A cytoplasmic domain. (B) Fibroblasts were transfected with tac (a) or tac-β1 (b), or cotransfected with tac-β1 and myr-PKCε-Flag (c and e) or tac-β1 and myc-V38R-Ras (d and f). Cell area for 100 randomly sampled positively transfected cells is plotted as a function of either tac epitope expression (a–d), myr-PKCε-Flag expression (e) for the same cells shown in c, or myc-V38R-Ras expression (f) for the same cells shown in d. The x axis is a linear scale of cell area from 0 to 1,600 μm2, the y axis is a linear scale of either FITC fluorescence (tac epitope expression) units defined by Image Pro-Plus from 0 to 2.4 × 10⁴ (a–d) or rhodamine fluorescence (Flag or myc epitope expression) from 0 to 1.2 × 10⁵ (e and f). (C) Fibroblasts were transfected with tac (a) or tac-β1 (b), or cotransfected with tac-β1 and myc-L61Rac1 (c and d). Cell area for 90 randomly sampled cells expressing tac, tac-β1, or coexpressing tac-β1 and myc-L61Rac1 is plotted as a function of tac epitope expression (a–c) or myc epitope expression (d) for the cells shown in c. The x axis is a linear scale of cell area from 0 to 2,400 μm2, the y axis is a linear scale of FITC fluorescence (tac epitope expression) from 0 to 2.4 × 10⁴ (a–c) or rhodamine fluorescence (myc epitope expression) from 0 to 1.2 × 10⁵ (d). (D) Fibroblasts transfected with the control tac receptor (a) or tac-β1 (b) or tac-β1 and p110α-CAAX (c) were analyzed for cell-surface expression of the tac epitope and cell area, as described in Materials and Methods. Cell area for 98 randomly sampled positively transfected cells is plotted as a function of tac epitope expression. The x axis is a linear scale of cell area from 0 to 2,400 μm2 and the y axis is a linear scale of FITC fluorescence (tac epitope expression) from 0 to 3.2 × 10⁴ (a) or 0 to 1.6 × 10⁴ (b and c). (B–D) The vertical line positioned at a cell area of 560 μm2 indicates the separation of spread (right) and not spread (left) cells. It is important to note that our spreading assays primarily analyze cells expressing moderate to low levels of tac-β1, since cell attachment to collagen I is inhibited by the expression of high levels of tac-β1 (data not shown). This observation is consistent with our recent studies showing that high levels of tac-β1 inhibit cell attachment to fibronectin (Mastrangelo et al. 1999a). The range of FITC fluorescence represents the range of tac-β1 expression detected in the adherent transfected cells. These experiments were performed three times and similar results were obtained.
Figure 3
Figure 3
The kinase activity of PKCε is required to increase the spreading of cells coexpressing tac-β1. Transiently transfected cells were plated on collagen I and analyzed for cell area (x axis) and expression of recombinant proteins (y axis): cells expressing tac (a) or tac-β1 (b) were analyzed for cell area and tac epitope expression; cells coexpressing tac and PKCε were analyzed for cell area and tac (c) or PKCε (d) expression; cells coexpressing tac and W437PKCε were analyzed for cell area and tac (e) or PKCε (f) expression; cells coexpressing tac-β1 and PKCε were analyzed for cell area and tac-β1 (g) or PKCε (h) expression; and cells coexpressing tac-β1 and W437PKCε were analyzed for cell area and tac-β1 (i) or PKCε (j) expression. In each instance, 100 randomly sampled positively transfected cells were analyzed. The x axis is a linear scale of cell area from 0 to 4.0 × 103 μm2. The y axis is a linear scale of FITC fluorescence (tac epitope expression) from 0 to 5.0 × 10⁴ (a–c, e, g, and i), or rhodamine fluorescence (PKCε expression) from 0 to 3.0 × 10⁵ (d, f, h, and j). The vertical line positioned at a cell area of 560 μm2 indicates the separation of spread (right) and not spread (left) cells. This experiment was performed twice and similar results were observed.
Figure 2
Figure 2
Coexpression of either N43R-Ras or N17Rac1 with tac-β1 does not restore cell spreading on collagen I. Transiently transfected cells were plated on collagen I and analyzed for cell area (x axis) and expression of recombinant proteins (y axis): cells transfected with tac (a) or tac-β1 alone (b) were analyzed for cell area and tac epitope expression; cells cotransfected with tac and myc-N43R-Ras were analyzed for cell area and tac (c) or myc (d) epitope expression; cells cotransfected with tac and myc-N17Rac1 were analyzed for cell area and tac (e) or myc (f) epitope expression; cells cotransfected with tac-β1 and myc-V38R-Ras were analyzed for cell area and tac (g) or myc (h) epitope expression; cells cotransfected with tac-β1 and myc-N43R-Ras were analyzed for cell area and tac epitope (i) or myc (j) epitope expression; and cells cotransfected with tac-β1 and myc-N17Rac1 were analyzed for cell area and tac (k) or myc (l) epitope expression. In each instance, cell area and epitope expression was analyzed for 100 randomly sampled cells. The x axis is a linear scale of cell area from 0 to 2.5 × 103 μm2. The y axis is a linear scale of FITC fluorescence (tac epitope expression) from 0 to 105 (a, c, and e) and from 0 to 2.5 × 10⁴ (b, g, i, and k), or rhodamine fluorescence (myc epitope expression) from 0 to 8.0 × 10⁴ (d, f, h, j, and l). The vertical line positioned at a cell area of 560 μm2 indicates the separation of spread (right) and not spread (left) cells. This experiment was performed twice and similar results were observed.
Figure 4
Figure 4
The morphology of cotransfected cells adherent to collagen I. (A) The morphology of cells expressing tac or tac-β1 alone or cells coexpressing tac-β1 and either V38R-Ras, L61Rac1, or myr-PKCε. Shown is tac epitope expression (FITC fluorescence) for representative cells from the quantitative experiment shown in Fig. 1. Also included is tac-β1 expression of a representative cell from the cotransfection of tac-β1 and p110α-CAAX. Fluorescence images were obtained with Spot software and composites were generated in adobe photoshop. Scale bar: 10 μm. (B) Coexpression of either V38R-Ras, L61Rac1, or myr-PKCε in addition to rescuing cell spreading also restores the localization of tac-β1 to the focal contact. Fibroblasts were cotransfected with tac-β1 and either V38R-Ras, L61Rac1, or myr-PKCε, and cells adherent to collagen were costained for tac and signaling protein expression as described previously. The tac-FITC staining (right) and corresponding interference reflection pattern (left) of coexpressing cells is shown. Scale bar: 10 μm.
Figure 4
Figure 4
The morphology of cotransfected cells adherent to collagen I. (A) The morphology of cells expressing tac or tac-β1 alone or cells coexpressing tac-β1 and either V38R-Ras, L61Rac1, or myr-PKCε. Shown is tac epitope expression (FITC fluorescence) for representative cells from the quantitative experiment shown in Fig. 1. Also included is tac-β1 expression of a representative cell from the cotransfection of tac-β1 and p110α-CAAX. Fluorescence images were obtained with Spot software and composites were generated in adobe photoshop. Scale bar: 10 μm. (B) Coexpression of either V38R-Ras, L61Rac1, or myr-PKCε in addition to rescuing cell spreading also restores the localization of tac-β1 to the focal contact. Fibroblasts were cotransfected with tac-β1 and either V38R-Ras, L61Rac1, or myr-PKCε, and cells adherent to collagen were costained for tac and signaling protein expression as described previously. The tac-FITC staining (right) and corresponding interference reflection pattern (left) of coexpressing cells is shown. Scale bar: 10 μm.
Figure 5
Figure 5
The morphology of cells expressing either p110α-CAAX, L61Rac1, N17Rac1, V38R-Ras, N43R-Ras, or myr-PKCε. Normal fibroblasts were transfected with tac alone or each of the signaling proteins, and subsequently replated onto collagen I as described in Materials and Methods. Adherent cells were immunostained for expression of the tac epitope in cells transfected with the control tac receptor alone or cotransfected with the control tac receptor and p110α-CAAX. Cells were immunostained for expression of the flag epitope in cells transfected with myr-PKCε-Flag, or the myc epitope in the case of myc-L61Rac1, myc-N17Rac1, myc-V38R-Ras, and myc-N43R-Ras. Staining was visualized using rhodamine-conjugated secondary antibodies. Fluorescence images were obtained as described in Fig. 4. Scale bar: 10 μm.
Figure 6
Figure 6
The rescue of tac-β1–inhibited cell spreading on collagen I is a β1 integrin–dependent process. Human fibroblasts transfected with the control tac receptor alone (A, a and e, and B, a and c) or cotransfected with tac-β1 and either p110α-CAAX (A, b and f), myr-PKCε (A, c and g), V38R-Ras (A, d and h), or L61Rac1 (B, b and d) were analyzed for spreading on collagen I in the presence of control ascites (A, a–d, and B, a and b) or β1 function blocking P4C10 ascites (A, e–h, and B, c and d) as described in Materials and Methods. The extent of cell spreading and the expression levels of the tac epitope were quantified for 100 (A) or 80 (B) randomly sampled positively transfected cells, and the results are shown by dot plot. The x axis is a linear scale of cell area from 0 to 3.2 × 103 μm2 (A and B). The y axis is a linear scale of FITC fluorescence (tac epitope expression) from 0 to 2.4 × 10⁴ (A and B). The vertical line positioned at a cell area of 560 μm2 indicates the separation of spread (right) and not spread (left) cells. These experiments were performed twice and similar results were obtained.
Figure 7
Figure 7
The rescue of cell spreading by p110α-CAAX, V38R-Ras, L61Rac1, and myr-PKCε is dependent upon integrin β cytoplasmic domains. Stable CHO cell lines A5 (left) and ETC12 (right) were each transfected with either tac (a and b) or tac-β1 alone (c and d) and the extent of cell spreading on fibrinogen was analyzed. In addition, A5 (left) and ETC12 (right) cells were cotransfected with tac-β1 and either p110α-CAAX (e and f), V38R-Ras (g and h), L61Rac1 (i and j), or myr-PKCε (k and l) and the extent of cell spreading on fibrinogen was analyzed. In each case, 90 randomly sampled positively transfected cells expressing both tac-β1 and the signaling protein where appropriate were analyzed for tac epitope expression and cell area. The data are shown on the dot plots of tac epitope expression versus cell area. The x axis is a linear scale of cell area from 0 to 1.6 × 103 μm2, and the y axis is a linear scale of FITC fluorescence (tac epitope expression) from 0 to 4.8 × 10⁴ (a and b) or 0 to 3.2 × 10⁴ (c–l). These experiments were performed three times and similar results were obtained.
Figure 8
Figure 8
PI 3-kinase activity is required for V38R-Ras, but not for L61Rac1 or myr-PKCε, to rescue cell spreading. Normal fibroblasts were transfected with either tac alone (A, a and e, and B, a and c) or cotransfected with tac-β1 and either V38R-Ras (B, b and d), p110α-CAAX (A, b and f), L61Rac1 (A, c and g), or myr-PKCε (A, d and h), and the morphology of cells adherent to collagen was analyzed in the presence of the PI 3-kinase inhibitor, LY294002 (A, e–h, and B, c and d), or DMSO (A, a–d, and B, c and d) as described in Materials and Methods. In each case, 100 (A) or 95 (B) randomly sampled transfected cells were analyzed for tac epitope expression and cell area as described previously. The x axis is a linear scale of cell area from 0 to 2.4 × 103 μm2 (A) or 0 to 3.2 × 103 μm2 (B), and the y axis is a linear scale of FITC fluorescence (tac epitope expression) from 0 to 4.8 × 10⁴ (A, a and e) or 0 to 2.4 × 10⁴ (A, b–d and f–h, and B, b, d) or 0 to 8.0 × 10⁴ (B, a and c). The vertical line positioned at 560 μm2 indicates the separation of spread (right) and not spread (left) cells. These experiments were performed three times and similar results were obtained.
Figure 9
Figure 9
Models for the rescue of tac-β1–inhibited cell spreading. (a, Model I) Expression of tac-β1 results in the titration of cellular factors from the endogenous β cytoplasmic domains that trigger the activation of signaling proteins required for cell spreading. The coexpression of activated recombinant signaling proteins with tac-β1 may bypass this block in integrin signaling and restore cell spreading. Tac-β1 does not inhibit integrin β cytoplasmic domain function that is required downstream of these signaling proteins. (b, Model II) Integrin-mediated cell attachment activates signaling proteins that regulate the binding of proteins to endogenous β cytoplasmic domains that are required for cell spreading. Expression of tac-β1 titrates these adhesion-induced protein interactions with the integrin β cytoplasmic domains. Coexpression of activated signaling proteins with tac-β1 increases the pool of proteins that bind the integrin β cytoplasmic domain and restores endogenous integrin function in cell spreading. (Model III). Tac-β1 inhibits the adhesion-induced activation of these signaling proteins and additionally inhibits protein interactions with the β cytoplasmic domain that are triggered by the signaling proteins (not shown).

Similar articles

Cited by

References

    1. Burridge K., Chrzanowska-Wodnicka M. Focal adhesions, contractility, and signaling. Annu. Rev. Cell Dev. Biol. 1996;12:463–519. - PubMed
    1. Chen H.-C., Guan J.-L. Association of focal adhesion kinase with its potential substrate phosphatidylinositol 3-kinase. Proc. Natl. Acad. Sci. USA. 1994;91:10148–10152. - PMC - PubMed
    1. Chen Y.-P., O'Toole T.E., Shipley T., Forsyth J., LaFlamme S.E., Yamada K.M., Shattil S.J., Ginsberg M.H. “Inside-out” signal transduction inhibited by isolated integrin cytoplasmic domains. J. Biol. Chem. 1994;269:18307–18310. - PubMed
    1. Chou M.M., Hou W., Johnson J., Graham L.K., Lee M.H., Chen C.-S., Newton A.C., Schaffhausen B.S., Toker A. Regulation of protein kinase C ζ by PI 3-kinase and PDK-1. Curr. Biol. 1998;8:1069–1077. - PubMed
    1. Chun J.-S., Ha M.-J., Jacobson B.S. Differential translocation of protein kinase C ε during HeLa cell adhesion to a gelatin substratum. J. Biol. Chem. 1996;271:13008–13012. - PubMed

Publication types

MeSH terms