. 2001 Jan;107(1):35-44.
doi: 10.1172/JCI10564.

Postnatal expression in hyaline cartilage of constitutively active human collagenase-3 (MMP-13) induces osteoarthritis in mice

Affiliations

Postnatal expression in hyaline cartilage of constitutively active human collagenase-3 (MMP-13) induces osteoarthritis in mice

L A Neuhold et al. J Clin Invest. 2001 Jan.

Abstract

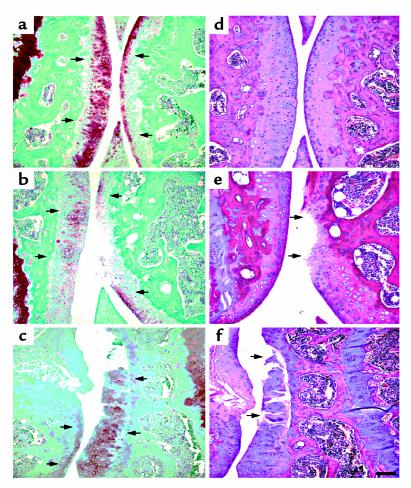
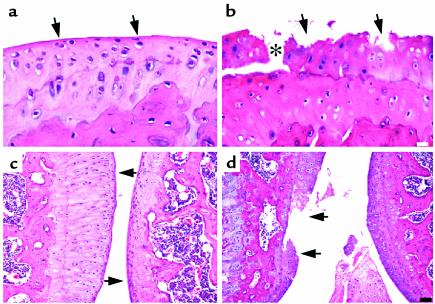
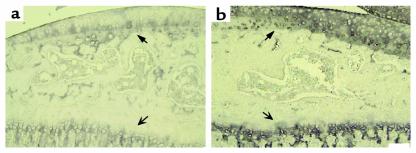
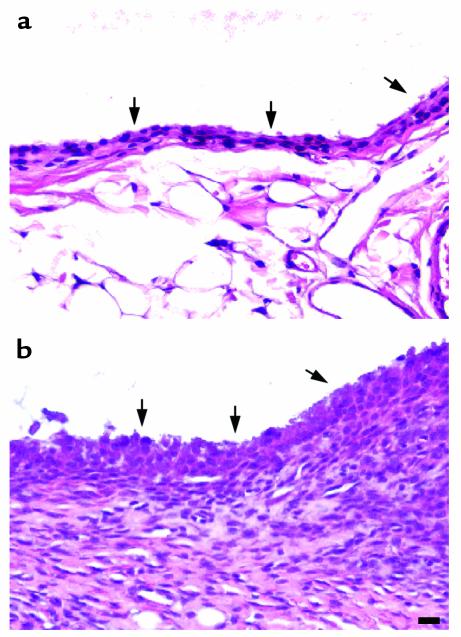
It has been suggested that increased collagenase-3 (MMP-13) activity plays a pivotal role in the pathogenesis of osteoarthritis (OA). We have used tetracycline-regulated transcription in conjunction with a cartilage-specific promoter to target a constitutively active human MMP-13 to the hyaline cartilages and joints of transgenic mice. Postnatal expression of this transgene resulted in pathological changes in articular cartilage of the mouse joints similar to those observed in human OA. These included characteristic erosion of the articular cartilage associated with loss of proteoglycan and excessive cleavage of type II collagen by collagenase, as well as synovial hyperplasia. These results demonstrate that excessive MMP-13 activity can result in articular cartilage degradation and joint pathology of the kind observed in OA, suggesting that excessive activity of this proteinase can lead to this disease.


Figures

Figure 1
Figure 1
Transgenic mice expressing β-galactosidase under the control of the rat type II collagen promoter. (a) Whole-mount staining for β-galactosidase activity on E16 embryos. The embryos show staining of the transgenic compared with a wild-type embryo. (b) Enlargement of the elbow and front paw.
Figure 2
Figure 2
Expression profile of the tTA and MMP-13* RNA by RT-PCR. (a) Amplification of MMP13* in each of the transgenic lines. Lane 1: φx174 Hae III MW markers; lane 2: PCR amplification of transgenic (line 6) genomic DNA; lane 3: PCR amplification of nontransgenic genomic DNA; lane 4: a wild-type mouse maintained on Dox; lane 5: a wild-type mouse off Dox; lanes 6–7, 8–9, 10–11, and 12–13: heterozygous lines 6, 8, 42, and 99 (4 weeks) removed from Dox at birth, respectively (duplicate). (b and c) Amplification of tTA (b) and MMP-13* (c) cDNA from total RNA. Lanes 1–5: same as in a; lanes 6–7: transgenic mouse (4 weeks) maintained on Dox (duplicate); lanes 8–9: transgenic mouse (4 weeks) removed from Dox at birth (duplicate). The 859-bp fragment and the 648-bp fragment represent the tTA RNA and the MMP-13* RNA, respectively. Each reaction was run using c-fos primers as an internal control, spliced mRNA yielding 187 bp, and unspliced mRNA 303 bp. Note, no bands were detected in corresponding lanes containing RNA for PCR that was not treated with M-MLV RT (data not shown). Moreover, PCR fragments were transferred to a nylon membrane and hybridized to a tTA or MMP-13 transgene-specific probe to verify the identity of the PCR product (data not shown).
Figure 3
Figure 3
Photomicrographs of immunohistochemical analysis of knee joints from 5-month-old mice. The left panels (a and c) represent sagittal sections of the tibia from wild-type mice, and the right panels (b and d) represent sagittal sections of the tibia from heterozygous line 6 mice. Expression of MMP-13* and its activity was confirmed by staining for MMP-13 and its activity. Section from a wild-type (a) and a transgenic (b) mouse stained with the rabbit anti-human MMP-13 polyclonal antibody; and adjacent sections from a wild-type (c) and a transgenic (d) mouse stained with the COL2-3/4Cs antibody that detects the primary collagenase cleavage site in type II collagen. The arrows represent staining in pericellular sites around chondrocytes. Scale bar = 30 μm.
Figure 4
Figure 4
Photomicrographs of the articular cartilage of the tibia (right) and femur (left), taken from 5-month-old mice removed from Dox at weaning (21 days). (ac) Sagittal sections from a wild-type (a) and a heterozygous (b) line 6 and a coronal section from homozygous line 99 (c) stained with safranin O. (df) A serial section from each animal stained with H&E. The arrows in a, b, and c represent areas of safranin O staining, whereas the arrows in e and f point to focal lesions and degradation of the articular cartilage. Scale bar = 100 μm.
Figure 5
Figure 5
Photomicrographs of sagittal sections of the hind knee joint stained with H&E at high magnification (a and b) and at low magnification (c and d) from heterozygous line 6. Sections of the tibia articular cartilage from wild-type (a and c) and transgenic (b and d) mice are shown. In c and d, the tibia is on the left and the femur is on the right. The arrows in a and c point to the smooth articular surface, whereas the arrows in b and d point to the degraded articular surface. Analysis was performed on 5-month-old mice removed from Dox at 21 days. The white scale bar in b represents 30 μm, and the black scale bar in d represents 100 μm.
Figure 6
Figure 6
Photomicrographs to show localization of type X collagen in the tibia articular cartilage and growth plate from sagittal sections of a wild-type (a) and heterozygous (b) line 6 mouse. The bold arrows represent the articular cartilage, whereas the open arrows indicate the growth plate. Analysis was performed on simultaneously stained sections taken from 3-month-old mice removed from Dox at 21 days. Scale bar = 100 μm.
Figure 7
Figure 7
Photomicrographs to show synovial hyperplasia in 5-month-old mice removed from Dox at weaning. Sagittal sections were cut to show the synovium from a wild-type (a) and a heterozygous (b) line 6 mouse stained with H&E. The arrows point to the synovial membrane. Scale bar = 30 μm.

Comment in

Similar articles

Cited by

References

    1. Poole, A.R., Alini, M., and Hollander, A. 1995. Cellular biology of cartilage degradation. In Mechanisms and models in rheumatoid arthritis. B. Henderson, R Pettifer, and J. Edwards, editors. Academic Press. New York, New York, USA. 163–204.
    1. Hollander AP, et al. Damage to type II collagen in aging and osteoarthritis starts at the articular surface, originates around chondrocytes, and extends into the cartilage with progressive degeneration. J Clin Invest. 1995;96:2859–2869. - PMC - PubMed
    1. Hollander AP, et al. Increased damage to type II collagen in osteoarthritic cartilage detected by a new immunoassay. J Clin Invest. 1994;93:1722–1732. - PMC - PubMed
    1. Billinghurst RC, et al. Enhanced cleavage of type II collagen by collagenases in osteoarthritic articular cartilage. J Clin Invest. 1997;99:1534–1545. - PMC - PubMed
    1. Nelson F, et al. Evidence for altered synthesis of type II collagen in patients with osteoarthritis. J Clin Invest. 1998;102:2115–2125. - PMC - PubMed

Publication types