. 2001 Jan;117(1):27-42.
doi: 10.1085/jgp.117.1.27.

Light adaptation in Drosophila photoreceptors: II. Rising temperature increases the bandwidth of reliable signaling

Affiliations

Light adaptation in Drosophila photoreceptors: II. Rising temperature increases the bandwidth of reliable signaling

M Juusola et al. J Gen Physiol. 2001 Jan.

Abstract

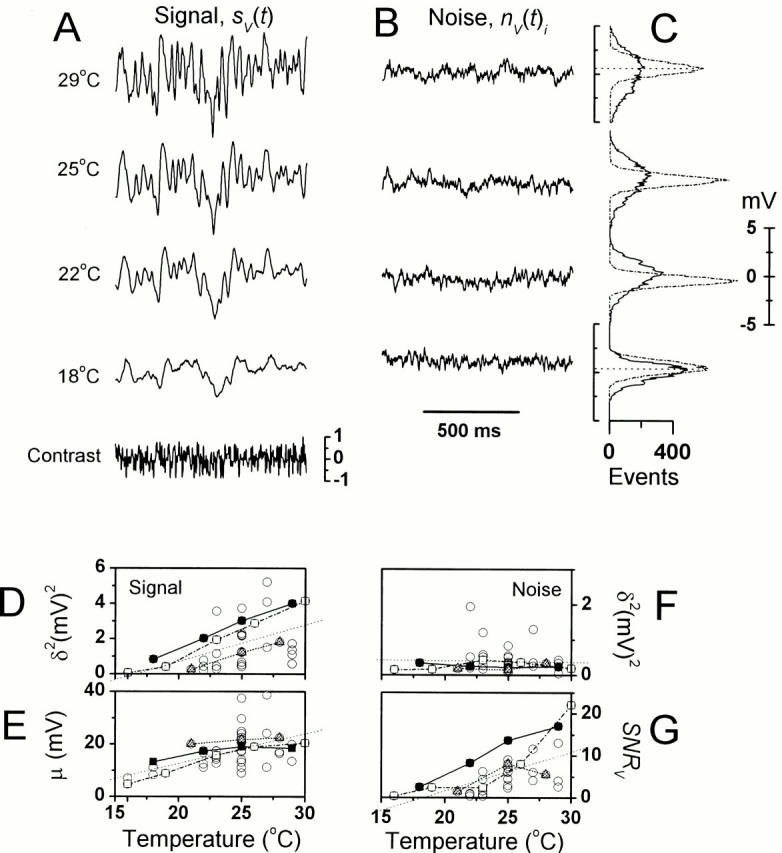
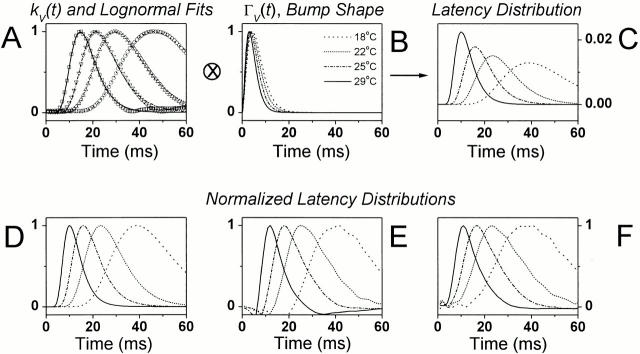
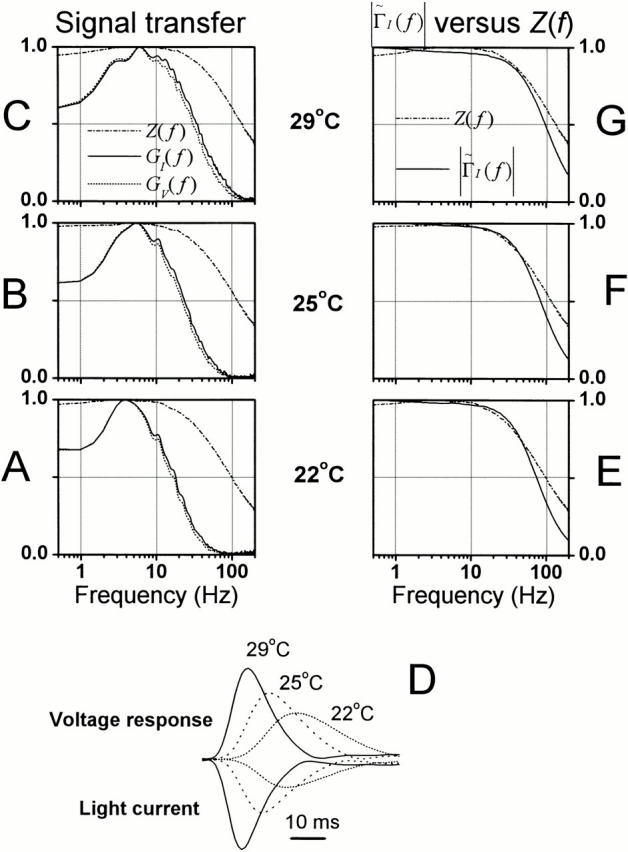
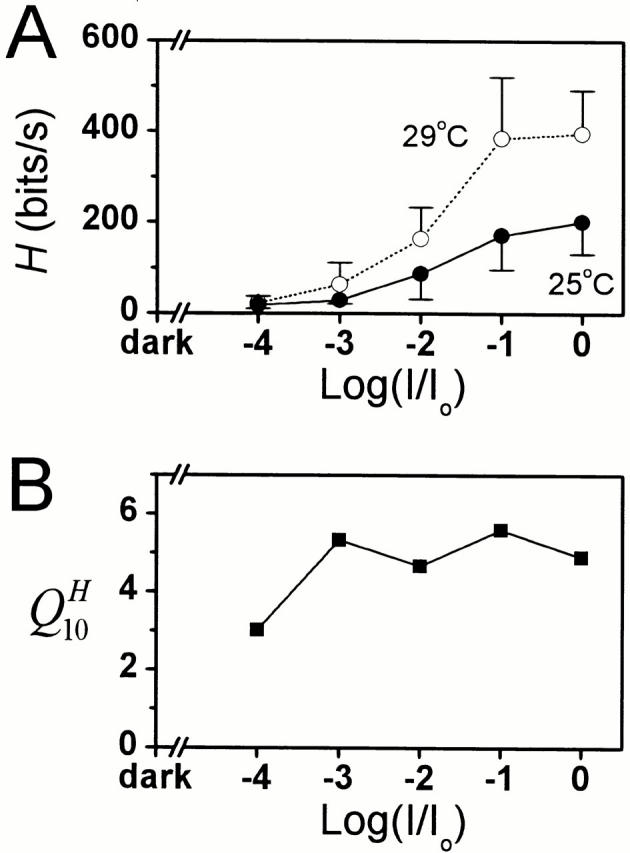
It is known that an increase in both the mean light intensity and temperature can speed up photoreceptor signals, but it is not known whether a simultaneous increase of these physical factors enhances information capacity or leads to coding errors. We studied the voltage responses of light-adapted Drosophila photoreceptors in vivo from 15 to 30 degrees C, and found that an increase in temperature accelerated both the phototransduction cascade and photoreceptor membrane dynamics, broadening the bandwidth of reliable signaling with an effective Q(10) for information capacity of 6.5. The increased fidelity and reliability of the voltage responses was a result of four factors: (1) an increased rate of elementary response, i.e., quantum bump production; (2) a temperature-dependent acceleration of the early phototransduction reactions causing a quicker and narrower dispersion of bump latencies; (3) a relatively temperature-insensitive light-adapted bump waveform; and (4) a decrease in the time constant of the light-adapted photoreceptor membrane, whose filtering matched the dynamic properties of the phototransduction noise. Because faster neural processing allows faster behavioral responses, this improved performance of Drosophila photoreceptors suggests that a suitably high body temperature offers significant advantages in visual performance.


Figures

Figure 1
Figure 1
Voltage responses of dark-adapted Drosophila photoreceptors to a saturating light impulse and light step at various temperatures. (A) Responses to a 1-ms light flash of 104 photons. The time to peak and width of the responses decreases with increasing temperature. (B) The onset of an adapting light background of BG0 (3 × 10⁶ photons/s) triggers saturating light responses, whose adaptation time course and plateau potential are temperature-dependent. The recordings are from the same photoreceptor at 18 and 28°C, respectively.
Figure 2
Figure 2
Voltage responses of light-adapted Drosophila photoreceptors to light contrast and current steps. The recordings are from two photoreceptors at two different temperatures, namely 29 and 24°C, at steady illumination with BG0. The steady-state potential in the two photoreceptors was −40 and −46 mV. (A) During prolonged light adaptation, depolarizing and hyperpolarizing photoreceptor responses were evoked by light increments and decrements, respectively, i.e., contrast steps (from c = −1 to c = +1), which showed nonlinear rectification with temperature-dependent characteristics. The voltage responses at 24°C are smaller and slower than those at 29°C. (B) The membrane properties of the photoreceptors were studied by injecting current pulses (from −0.2 to ±0.3 nA). Judged by the speed of the voltage responses, the photoreceptor membrane allows faster signaling at higher temperatures. The time courses of the current-induced voltage response are always faster than those elicited by light at the same temperature, indicating that neither the recording system nor the cell membrane is limiting the time course of the photoreceptor light responses. The contrast responses are averaged 30 times, and the current responses are averaged 5 (29°C) and 10 times 24°C).
Figure 3
Figure 3
Photoreceptor responses to dynamically modulated contrasts at BG0 at different temperatures. (A) The waveforms of the voltage signal, sV(t), and (B) the corresponding voltage noise, nV(t)i. (C) The noise had a Gaussian distribution (dots) at all temperatures, whereas the signal distribution (continuous lines) changed from Gaussian at cool temperatures to increasingly skewed at higher temperatures. (D) The signal size (indicated here as its variance, δ 2) increases sometimes over 15-fold, and its mean (E) is elevated by over 20 mV as the temperature increases by >10°C. (F) The noise variance does not change significantly with warming. (G) The changes in the signal and noise variance led to a continuously improving photoreceptor (SNRV) with increasing temperature. (D–G) The black and white squares indicate the recordings from (. of Juusola and Hardie 2000, in this issue) two photoreceptors, whose signaling was studied over a 10°C temperature range. Closed triangles indicate a photoreceptor that was studied over a 7°C range. The thin, dotted lines in the figures represent the trend (i.e., the linear fits over all the data points).
Figure 4
Figure 4
The photoreceptor response dynamics at BG0 at different temperatures. (A) The signal power spectra, |〈SV( f )〉|2, (B) noise power spectra, |〈NV(f )〉|2, and (C) SNRV(f ) calculated via the FFT (see Juusola and Hardie 2000). (D) The information at different temperatures, log2[SNRV(f ) + 1], and (E) the information capacity, the integral of the information over all frequencies (Juusola and Hardie 2000). (F) The bump noise power (continuous lines) was isolated by subtracting the photoreceptor noise power spectrum, measured at darkness, from the power spectrum, measured at the BG0, and fitted with single Lorentzians (dotted lines). This gives us the two parameters (n and τ) for calculating the bump shape (G) and the effective bump duration (H) at BG0 (the symbols indicate the photoreceptors as previously described). The bump event rate (I) was estimated as described in the text ().
Figure 5
Figure 5
Frequency responses of light-adapted photoreceptors at different temperatures. According to the increasing gain function (A), the photoreceptor voltage responses to light contrast modulation becomes larger and faster with an increase in temperature. (B) The acceleration of the voltages can be seen from the temperature-dependent shift in their cut-off frequency; Q10 = 2.4. (C) This is also seen in the phase of the frequency response functions, PV(f ), which indicates that the photoreceptor voltage responses lags the stimulus less at warmer temperatures. Since the minimum phase function, Pmin(f ), calculated from the gain part of the frequency response function differs from the measured phase, PV(f ), the voltage response to a light stimulus contains a pure time delay or dead-time (D). The photoreceptor dead-time at bright illumination is reduced by warming from values above 20 ms at below 20°C to ∼5 ms at 30°C; Q10 = 3.1. The photoreceptor voltage responses are linear as revealed by both (E) the measured, γexp 2 f, and (F) the estimated, γSNR 2 f, coherence function. (G) The linear impulse responses, i.e., first order Wiener kernels, are larger and faster at warmer temperatures. (H) The temperature-induced increase in the photoreceptor's signal processing speed can be quantified as a change in the time-to-peak (tp) values; Q10 = 2.5.
Figure 6
Figure 6
Bump latency distribution at the adapting background of BG0 at different with temperatures. Removing the bump shape from the corresponding impulse response by deconvolution reveals the timing of the elementary responses, i.e., the bump latency distribution. (A) The log-normal approximations of the photoreceptor impulse responses, (B) the normalized Γ(t)-distribution fits of the bump waveform, and (C) the corresponding bump latency distributions at different temperatures. The normalized bump latency distributions (D) and those calculated from recorded voltage and light data as explained in (E) and (F) at different recording temperatures. Warming shortens and narrows the dispersion of bump latencies.
Figure 7
Figure 7
Voltage signals evoked by Gaussian current injection (A) and contrast (B) at different recording temperatures, and examples of the corresponding voltage noise traces. Both the current and contrast stimulation lasted 10 s and were repeated a minimum of 10 times. (C) The probability density distributions of the signal to light contrast (black areas) and current injection (scattered dots with Gaussian fits) at the adapting background of BG0 at 22, 25, and 29°C. The background light depolarizes the photoreceptor ∼15 to 20 mV above the resting potential at darkness (0 mV in C). The responses to light contrast are increasingly skewed, but they are Gaussian to a constant current injection. (D) The power spectra of the photoreceptor voltage noise, |〈NV(f )〉|2, at different temperature remain relatively unchanged, regardless of the Gaussian contrast (superscript C) and current (superscript I) modulation of the membrane potential.
Figure 8
Figure 8
The photoreceptor impedance, Z(f ), which was calculated from the injected current and the resulting voltage responses, is reduced (A, gain), speeded (B, 3 dB cut-off frequency) and lagged the stimulus less (C, phase) when shifting towards higher frequencies with increasing temperature. The membrane operates linearly over the studied frequency range, as judged by the close to unity coherence: (D) γexp 2 f and in (E) γSNR 2 f. Both the normalized impedance (F) and the gain of the contrast-induced voltage signals (G) show a gradual shift of their bandwidth towards high frequencies; the cut-off frequency of the impedance was always higher than that of the light responses, at all recording temperatures.
Figure 9
Figure 9
General comparison of the phototransduction signal and noise and membrane bandwidth at BG0 at different temperatures. (A–C) The dynamics of light current, voltage responses to light, and membrane impedance are displayed as their normalized frequency responses: GI(f ), GV(f ), and Z(f ), respectively. At BG0, regardless of the tested temperature the light current was smooth and had a much narrower bandwidth than the corresponding photoreceptor membrane. As the temperature is increased, both the phototransduction cascade and photoreceptor membrane allows faster signaling leading to accelerated voltage responses (i.e., GI(f ) hardly differs from GV(f )). The corresponding impulse responses (D), calculated from the same data, show how the light current and voltage responses quickens with warming, but the light current is always peaking before its corresponding voltage response. Because of the large membrane impedance at 22°C, the ratio between the corresponding light current and voltage response is larger than at warmer temperatures, where the photoreceptor impedance is less. The responses are normalized by the maximum value of each series. (E–G) The phototransduction bump noise, Γ̃I f, was calculated by deconvolving the photoreceptor membrane Z(f ) from the respective voltage bump noise, Γ̃V f, measured at different temperatures. From 22°C to 29°C Γ̃I f shows a considerable overlap with the corresponding membrane impedance indicating that the temperature-dependent shift in the membrane bandwidth effectively matches the temperature-dependent speed of the noise generating phototransduction processes.
Figure 10
Figure 10
The photoreceptor information capacity increases with mean light intensity and temperature. (A) The photoreceptor information capacity at 25 and 29°C measured at different adapting backgrounds of 3 × 10² (BG-4) to 3 × 10⁶ (BG0) photons/s (n = 5 in both temperatures). Increasing the photoreceptor temperature by 4° about doubles its information capacity. (B) This data was also used for calculating the Q10 for information capacity at different mean light intensity levels. The consistently high Q10 indicates that the large improvement in photoreceptor signaling is not a consequence of some saturation-related processes at bright light conditions, but reflects the increased speed and precision of the phototransduction reactions.

Similar articles

Cited by

References

    1. Aho A.C., Donner K., Hyden C., Larsen L.O., Reuter T. Low retinal noise in animals with low body-temperature allows high visual sensitivity. Nature. 1988;334:348–350. - PubMed
    1. French A.S. Phototransduction in the fly compound eye exhibits temporal resonances and a pure time delay. Nature. 1980;283:200–202. - PubMed
    1. French A.S., Järvilehto M. The dynamic behaviour of photoreceptor cells in the fly in response to random (white noise) stimulation at a range of temperatures. J. Physiol. 1978;274:311–322. - PMC - PubMed
    1. Hardie R.C. Voltage-sensitive potassium channels in Drosophila photoreceptors. J. Neurosci. 1991;10:3079–3095. - PMC - PubMed
    1. Heinrich B. The hod-blooded insects 1993. Springer-Verlag; Berlin: pp. 600 pp

Publication types