. 2001 Jan;75(2):759-71.
doi: 10.1128/JVI.75.2.759-771.2001.

Organization of immature human immunodeficiency virus type 1

Affiliations

Organization of immature human immunodeficiency virus type 1

T Wilk et al. J Virol. 2001 Jan.

Abstract

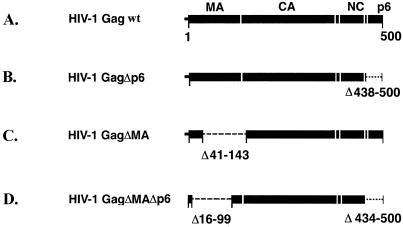
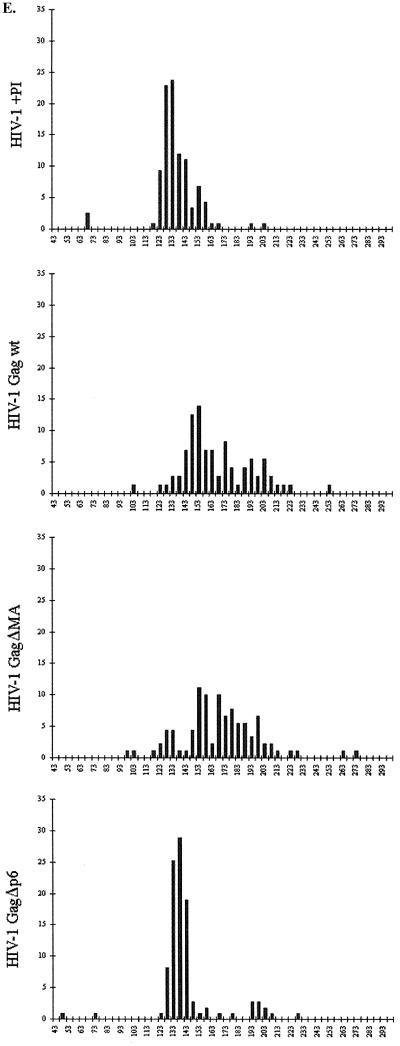
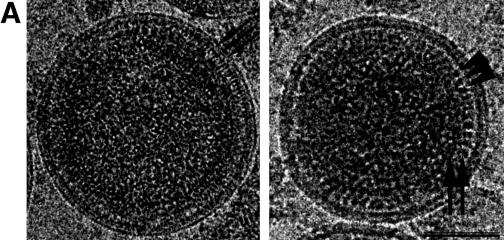
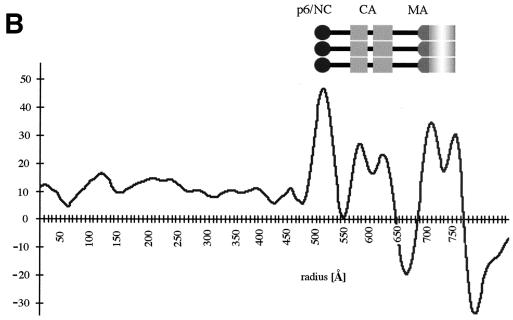
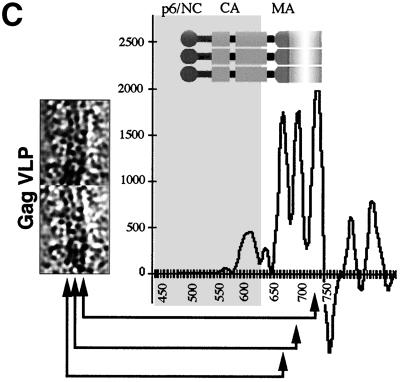
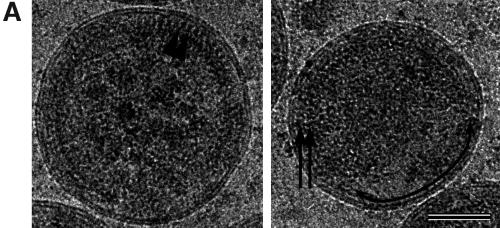
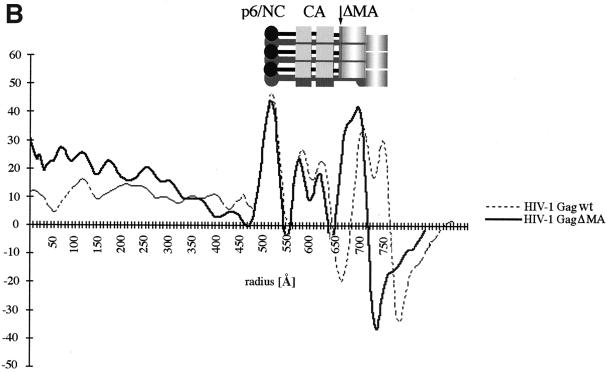
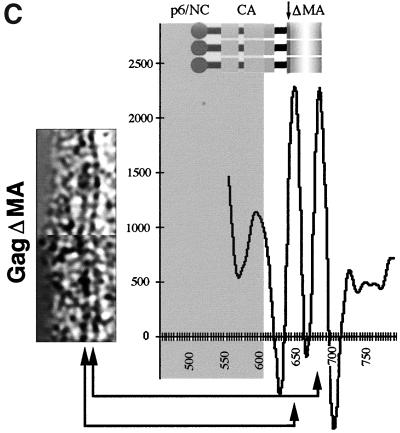
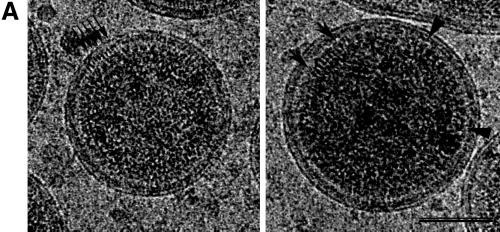
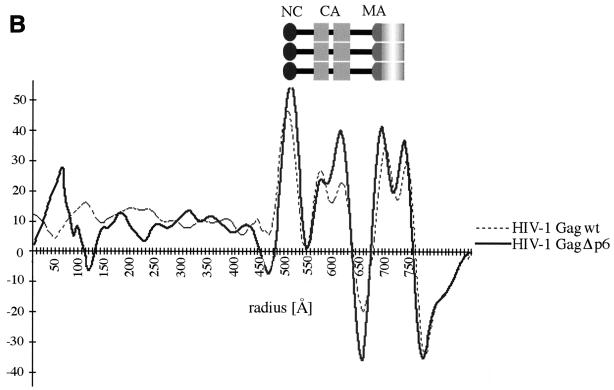
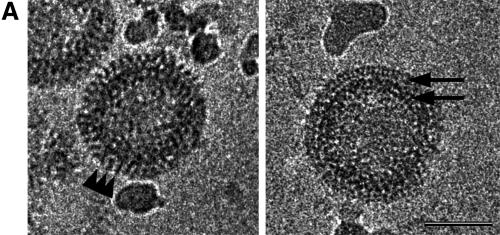
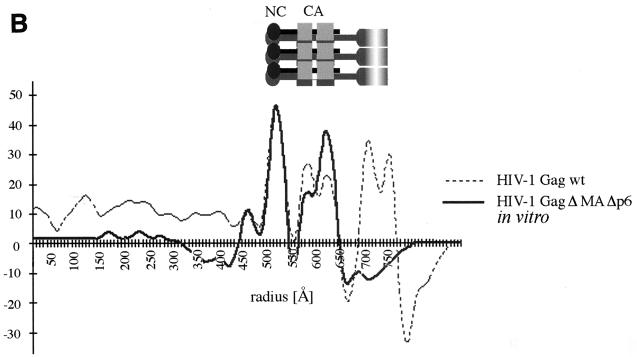
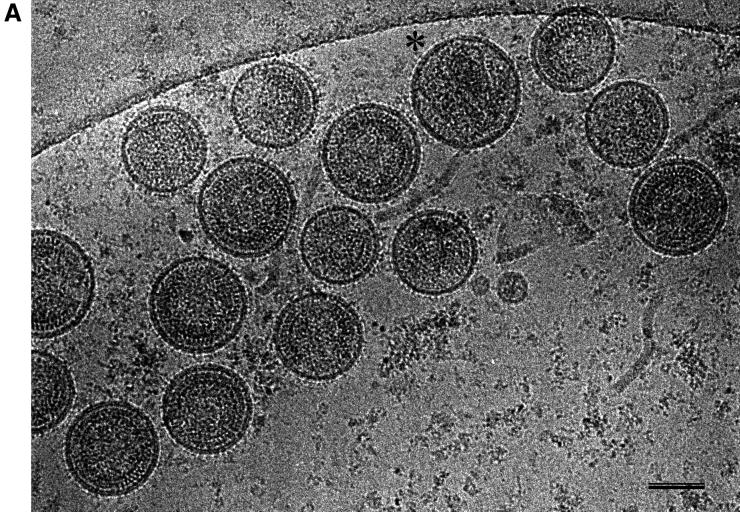
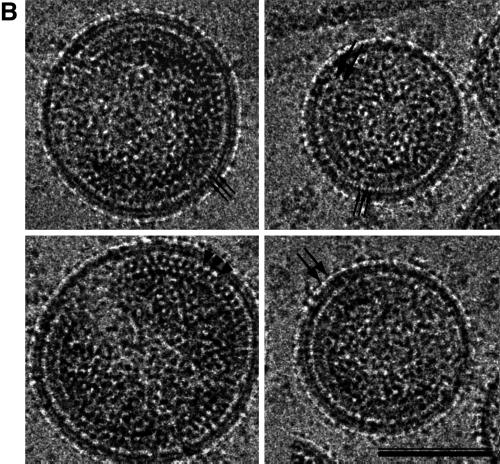
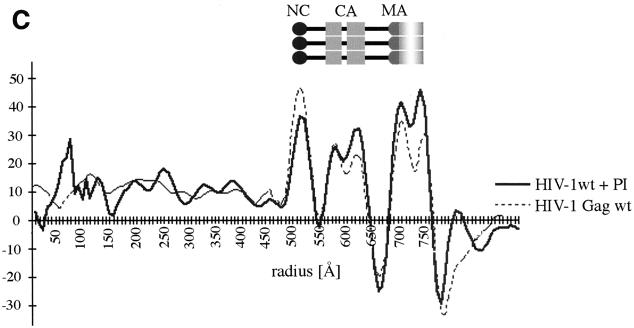
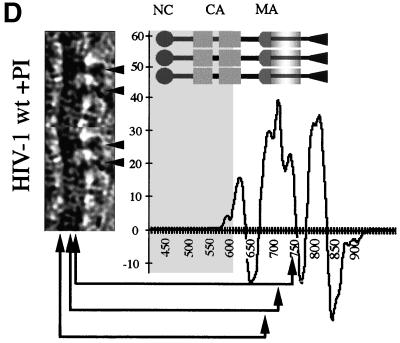
Immature retrovirus particles contain radially arranged Gag polyproteins in which the N termini lie at the membrane and the C termini extend toward the particle's center. We related image features to the polyprotein domain structure by combining mutagenesis with cryoelectron microscopy and image analysis. The matrix (MA) domain appears as a thin layer tightly associated with the inner face of the viral membrane, separated from the capsid (CA) layer by a low-density region corresponding to its C terminus. Deletion of the entire p6 domain has no effect on the width or spacing of the density layers, suggesting that p6 is not ordered in immature human immunodeficiency virus type 1 (HIV-1). In vitro assembly of a recombinant Gag polyprotein containing only capsid (CA) and nucleocapsid (NC) domains results in the formation of nonenveloped spherical particles which display two layers with density matching that of the CA-NC portion of immature HIV-1 Gag particles. Authentic, immature HIV-1 displays additional surface features and an increased density between the lipid bilayers which reflect the presence of gp41. The other internal features match those of virus-like particles.


Figures

FIG. 1
FIG. 1
Wild-type HIV-1 Gag and Gag deletion mutants. Constructs A through C were expressed in H5 cells by infection with recombinant baculovirus. Construct D was expressed in E. coli and assembled in vitro in the presence of oligonucleotides. (E) The histograms show the effect of the deletions on the particle size. The x axis indicates the particle diameter in nanometers, and the y axis indicates the frequency of occurrence in the population as a percentage.
FIG. 1
FIG. 1
Wild-type HIV-1 Gag and Gag deletion mutants. Constructs A through C were expressed in H5 cells by infection with recombinant baculovirus. Construct D was expressed in E. coli and assembled in vitro in the presence of oligonucleotides. (E) The histograms show the effect of the deletions on the particle size. The x axis indicates the particle diameter in nanometers, and the y axis indicates the frequency of occurrence in the population as a percentage.
FIG. 2
FIG. 2
Wild-type HIV-1 Gag particles in cEM. (A) cEM of wild-type Gag particles shows thin tethers (arrows, left panel) spanning the low density submembrane space. The density at the lower radius is subdivided into two major bands (arrows, right panel). Arrowheads mark the CA rods. Areas of white correspond to higher density and hence mass in all of the images presented. Scale bar, 50 nm. (B) The average of 10 radial density distributions of wild-type HIV-1 Gag particles aligned to the position of the membrane reflects the presence of radially arranged Gag domains. The inset shows the assignment of individual peaks of density to the domains of the HIV-1 Gag polyprotein. The plot shows density (y axis) as a function of distance from the particle center in angstroms (x axis). (C) CTF-corrected images of two typical regions of a VLP membrane and the corresponding average radial density distribution from 50 regions of the membranes of five Gag particles. The internal density is masked (gray area) in this image. The interpretation of the CTF-corrected density of the particle (left) is shown by the arrows matching its features with the corresponding radial density profile and a schematic of the arrangement of the proteins. The peaks corresponding to the MA domain and the inner leaflet of the membrane were not resolved in the uncorrected image (B) and are represented by a single, broad peak of density in the same radial position (C).
FIG. 2
FIG. 2
Wild-type HIV-1 Gag particles in cEM. (A) cEM of wild-type Gag particles shows thin tethers (arrows, left panel) spanning the low density submembrane space. The density at the lower radius is subdivided into two major bands (arrows, right panel). Arrowheads mark the CA rods. Areas of white correspond to higher density and hence mass in all of the images presented. Scale bar, 50 nm. (B) The average of 10 radial density distributions of wild-type HIV-1 Gag particles aligned to the position of the membrane reflects the presence of radially arranged Gag domains. The inset shows the assignment of individual peaks of density to the domains of the HIV-1 Gag polyprotein. The plot shows density (y axis) as a function of distance from the particle center in angstroms (x axis). (C) CTF-corrected images of two typical regions of a VLP membrane and the corresponding average radial density distribution from 50 regions of the membranes of five Gag particles. The internal density is masked (gray area) in this image. The interpretation of the CTF-corrected density of the particle (left) is shown by the arrows matching its features with the corresponding radial density profile and a schematic of the arrangement of the proteins. The peaks corresponding to the MA domain and the inner leaflet of the membrane were not resolved in the uncorrected image (B) and are represented by a single, broad peak of density in the same radial position (C).
FIG. 3
FIG. 3
HIV-1 GagΔMA particles visualized by cEM. (A) A cEM of an HIV Gag particle with a deletion of residues 41 to 143. The deletion of MA sequences results in the thinning of the submembrane space and a reduced inner leaflet thickness and affects the regular variation in density within the membrane. Frequently the internal organization is disrupted, and the regular array of Gag molecules is only preserved in limited regions of the circumference. The arc within the membrane (right) shows the presence of a vacant region of the particle. The arrowheads (left) mark CA-derived rods of Gag density while the arrows (right) mark radial CA and NC density. Size bar, 50 nm. (B) The radial density distribution of HIV-1 GagΔMA demonstrates the effect of the matrix deletion. The mutation results in an approximation of regular internal density and the particle membrane. The superimposition with the profile of wild-type Gag particles illustrates the effect of the deletion. The plot shows density (y axis) as a function of distance from the particle center in angstroms (x axis). (C) CTF-corrected image of the membrane region of an HIV-1 GagΔMA particle and the corresponding region of the average of the radial density distribution from 50 particles with the central region (gray) masked.
FIG. 3
FIG. 3
HIV-1 GagΔMA particles visualized by cEM. (A) A cEM of an HIV Gag particle with a deletion of residues 41 to 143. The deletion of MA sequences results in the thinning of the submembrane space and a reduced inner leaflet thickness and affects the regular variation in density within the membrane. Frequently the internal organization is disrupted, and the regular array of Gag molecules is only preserved in limited regions of the circumference. The arc within the membrane (right) shows the presence of a vacant region of the particle. The arrowheads (left) mark CA-derived rods of Gag density while the arrows (right) mark radial CA and NC density. Size bar, 50 nm. (B) The radial density distribution of HIV-1 GagΔMA demonstrates the effect of the matrix deletion. The mutation results in an approximation of regular internal density and the particle membrane. The superimposition with the profile of wild-type Gag particles illustrates the effect of the deletion. The plot shows density (y axis) as a function of distance from the particle center in angstroms (x axis). (C) CTF-corrected image of the membrane region of an HIV-1 GagΔMA particle and the corresponding region of the average of the radial density distribution from 50 particles with the central region (gray) masked.
FIG. 4
FIG. 4
HIV-1 GagΔp6 particles in cEM. (A) cEM of HIV-1 GagΔp6 particles shows no effect of the p6 deletion on the internal layers of density. Mutant particles display the same details as wild-type Gag particles. The arrows (left) mark the tethers. The arrows (right) indicate a region of typical rod density for comparison with a region of altered rod density marked by arrowheads. Bar, 50 nm. (B) Radial density distribution of HIV GagΔp6 particles. The superimposition with the radial density distribution of wild-type VLPs demonstrates that the C-terminal p6 domain does not contribute to the averaged innermost density of the Gag protein layer. The plot shows density (y axis) as a function of distance from the particle center in angstroms (x axis). Positive and negative density values correspond to areas of black/white in panel A, respectively.
FIG. 4
FIG. 4
HIV-1 GagΔp6 particles in cEM. (A) cEM of HIV-1 GagΔp6 particles shows no effect of the p6 deletion on the internal layers of density. Mutant particles display the same details as wild-type Gag particles. The arrows (left) mark the tethers. The arrows (right) indicate a region of typical rod density for comparison with a region of altered rod density marked by arrowheads. Bar, 50 nm. (B) Radial density distribution of HIV GagΔp6 particles. The superimposition with the radial density distribution of wild-type VLPs demonstrates that the C-terminal p6 domain does not contribute to the averaged innermost density of the Gag protein layer. The plot shows density (y axis) as a function of distance from the particle center in angstroms (x axis). Positive and negative density values correspond to areas of black/white in panel A, respectively.
FIG. 5
FIG. 5
cEM of in vitro-assembled HIV GagΔMAΔp6. (A) cEM of in vitro-assembled particles. Recombinant Gag polyprotein lacking the entire p6 domain and most of the MA domain (including the N-terminal myristic acid) can be assembled into spherical particles. The two major layers of density are marked by arrows (right). Note the rod-like shape of the outer protein layer (left, arrowheads), reminiscent of the CA protein layer in Gag particles. A second protein layer is located further inside and is similar in appearance to the innermost protein layer of Gag particles released from cells. Bar, 50 nm. (B) Radial density profile of HIV-1 GagΔMAΔp6 particles. The two main peaks of density corresponding to the CA and NC protein layers can easily be aligned with the radial density profiles of enveloped HIV-1 Gag particles. The plot shows density (y axis) as a function of distance from the particle center in angstroms (x axis).
FIG. 5
FIG. 5
cEM of in vitro-assembled HIV GagΔMAΔp6. (A) cEM of in vitro-assembled particles. Recombinant Gag polyprotein lacking the entire p6 domain and most of the MA domain (including the N-terminal myristic acid) can be assembled into spherical particles. The two major layers of density are marked by arrows (right). Note the rod-like shape of the outer protein layer (left, arrowheads), reminiscent of the CA protein layer in Gag particles. A second protein layer is located further inside and is similar in appearance to the innermost protein layer of Gag particles released from cells. Bar, 50 nm. (B) Radial density profile of HIV-1 GagΔMAΔp6 particles. The two main peaks of density corresponding to the CA and NC protein layers can easily be aligned with the radial density profiles of enveloped HIV-1 Gag particles. The plot shows density (y axis) as a function of distance from the particle center in angstroms (x axis).
FIG. 6
FIG. 6
cEM of immature HIV-1. (A) Overview of immature HIV-1 released from infected T cells. The image shows a typical low-magnification view of particles that have been released from T cells after treatment of the cells with an inhibitor of the viral protease (bar = 100 nm). Note the presence of spikes on the surface of the particles and the heterogeneity of diameters within the population. The asterisk marks a rare particle in the preparation (<1%) which shows a mature phenotype. (B) The details of the structure of the immature HIV-1 particle are seen in the views of individual particles. The two major layers of density are marked by arrows (upper right). Note the rod-like shape of the outer protein layer (arrowheads, lower left), reminiscent of the CA protein layer in Gag particles (bar = 100 nm). Small arrows mark the tethers in the upper-right panel and the glycoproteins in the lower-right panel. (C) The comparison of the radial density profiles of the immature virion and the wild-type VLP shows that the internal features are conserved. The plot shows density (y axis) as a function of distance from the particle center in angstroms (x axis). The two particles differ in the depth of the features in the membrane region and the presence of a weak average external density corresponding to that of the envelope proteins. (D) The CTF-corrected image of a portion of an immature particle reveals the extra density in the membrane region. The correspondence between the CTF-corrected image and the average radial density profile from 50 particles is indicated by the arrows matching their corresponding features with a schematic of the arrangement of the proteins. The internal density is masked (grey region).
FIG. 6
FIG. 6
cEM of immature HIV-1. (A) Overview of immature HIV-1 released from infected T cells. The image shows a typical low-magnification view of particles that have been released from T cells after treatment of the cells with an inhibitor of the viral protease (bar = 100 nm). Note the presence of spikes on the surface of the particles and the heterogeneity of diameters within the population. The asterisk marks a rare particle in the preparation (<1%) which shows a mature phenotype. (B) The details of the structure of the immature HIV-1 particle are seen in the views of individual particles. The two major layers of density are marked by arrows (upper right). Note the rod-like shape of the outer protein layer (arrowheads, lower left), reminiscent of the CA protein layer in Gag particles (bar = 100 nm). Small arrows mark the tethers in the upper-right panel and the glycoproteins in the lower-right panel. (C) The comparison of the radial density profiles of the immature virion and the wild-type VLP shows that the internal features are conserved. The plot shows density (y axis) as a function of distance from the particle center in angstroms (x axis). The two particles differ in the depth of the features in the membrane region and the presence of a weak average external density corresponding to that of the envelope proteins. (D) The CTF-corrected image of a portion of an immature particle reveals the extra density in the membrane region. The correspondence between the CTF-corrected image and the average radial density profile from 50 particles is indicated by the arrows matching their corresponding features with a schematic of the arrangement of the proteins. The internal density is masked (grey region).

References

    1. Accola M A, Hoglund S, Göttlinger H G. A putative alpha-helical structure which overlaps the capsid-p2 boundary in the human immunodeficiency virus type 1 Gag precursor is crucial for viral particle assembly. J Virol. 1998;72:2072–2078. - PMC - PubMed
    1. Adachi A, Gendelman H E, Koenig S, Folks T, Willey R, Rabson A, Martin M A. Production of acquired immunodeficiency syndrome-associated retrovirus in human and nonhuman cells transfected with an infectious molecular clone. J Virol. 1986;59:284–291. - PMC - PubMed
    1. Baker T S, Olson N H, Fuller S D. Adding the third dimension to virus life cycles: three-dimensional reconstruction of icosahedral viruses from cryo-electron micrographs. Microbiol Mol Biol Rev. 1999;63:862–922. - PMC - PubMed
    1. Carrière C, Gay B, Chazal N, Morin N, Boulanger P. Sequence requirements for encapsidation of deletion mutants and chimeras of human immunodeficiency virus type 1 Gag precurson into retrovirus-like particles. J Virol. 1995;69:2366–2377. - PMC - PubMed
    1. Coffin J M, Hughes S H, Varmus H E. Retroviruses. Cold Spring Harbor, N.Y: Cold Spring Harbor Laboratory Press; 1997. - PubMed

Publication types

MeSH terms

Substances