. 2001 Jan;21(2):511-23.
doi: 10.1128/MCB.21.2.511-523.2001.

Nucleocytoplasmic distribution of budding yeast protein kinase A regulatory subunit Bcy1 requires Zds1 and is regulated by Yak1-dependent phosphorylation of its targeting domain

Affiliations

Nucleocytoplasmic distribution of budding yeast protein kinase A regulatory subunit Bcy1 requires Zds1 and is regulated by Yak1-dependent phosphorylation of its targeting domain

G Griffioen et al. Mol Cell Biol. 2001 Jan.

Abstract

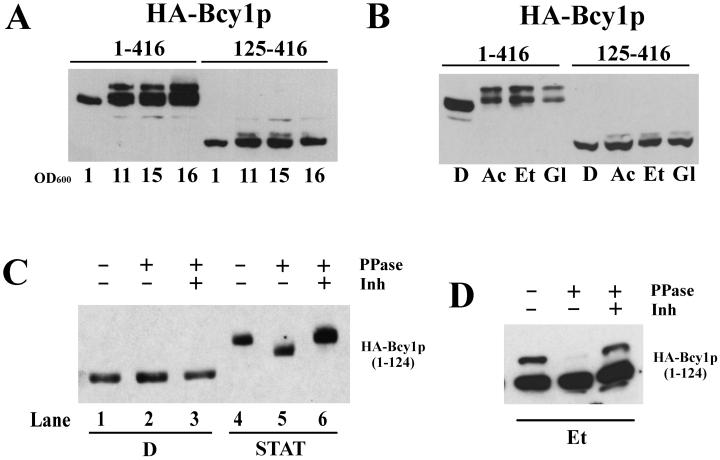
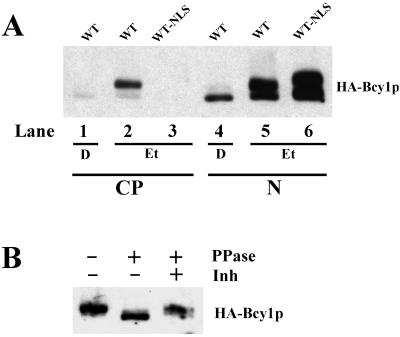
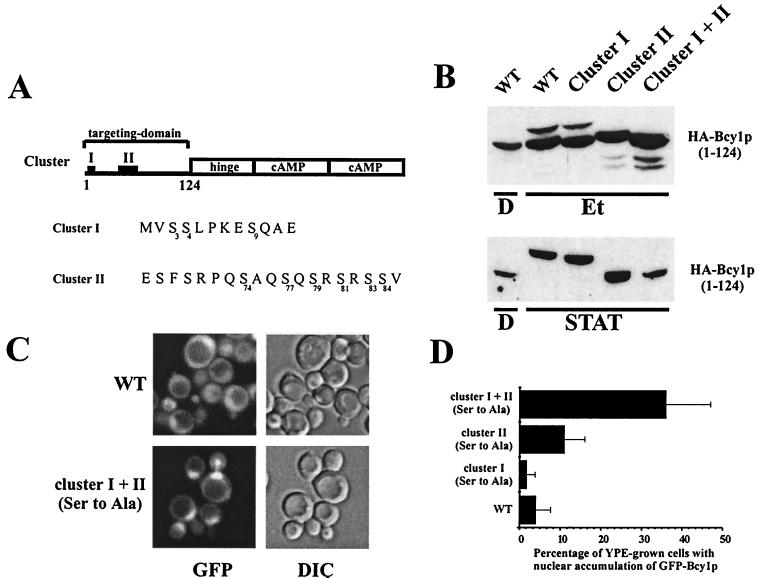
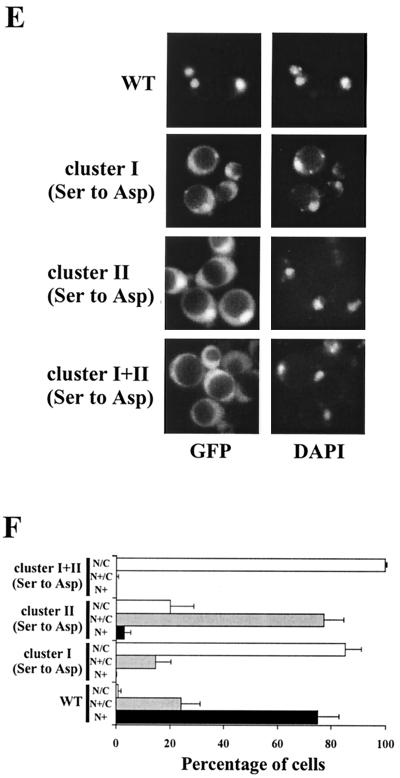
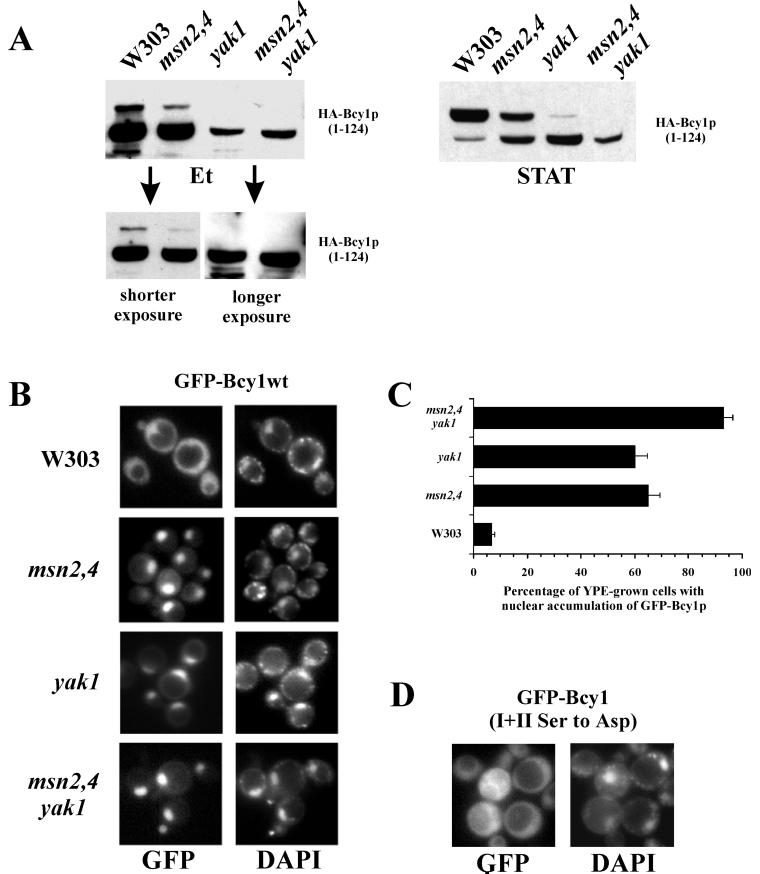
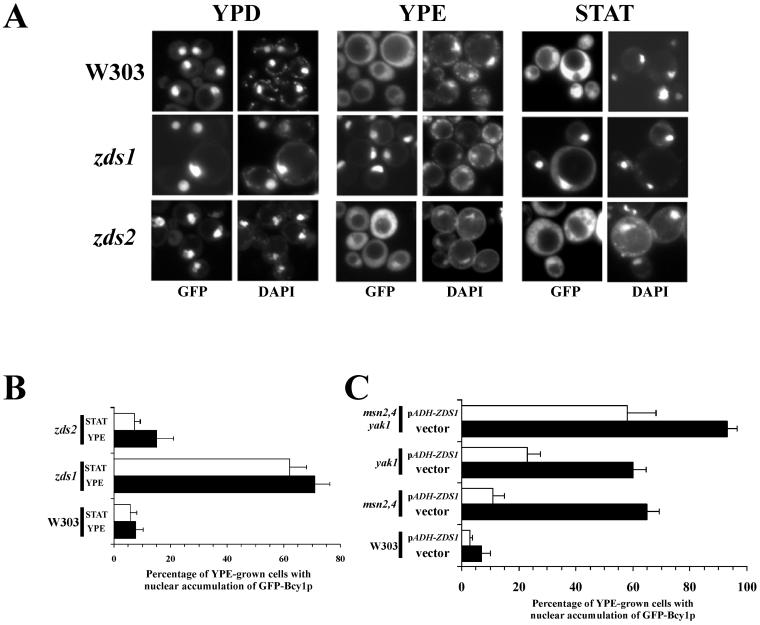
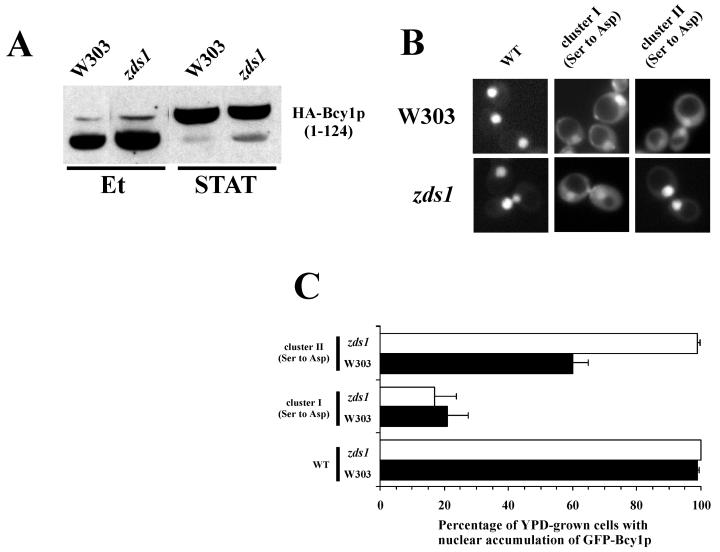
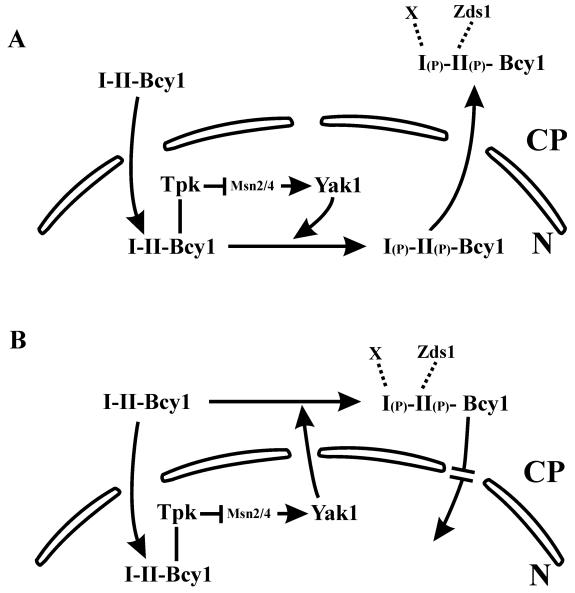
In Saccharomyces cerevisiae the subcellular distribution of Bcy1 is carbon source dependent. In glucose-grown cells, Bcy1 is almost exclusively nuclear, while it appears more evenly distributed between nucleus and cytoplasm in carbon source-derepressed cells. Here we show that phosphorylation of its N-terminal domain directs Bcy1 to the cytoplasm. Biochemical fractionation revealed that the cytoplasmic fraction contains mostly phosphorylated Bcy1, whereas unmodified Bcy1 is predominantly present in the nuclear fraction. Site-directed mutagenesis of two clusters (I and II) of serines near the N terminus to alanine resulted in an enhanced nuclear accumulation of Bcy1 in ethanol-grown cells. In contrast, substitutions to Asp led to a dramatic increase of cytoplasmic localization in glucose-grown cells. Bcy1 modification was found to be dependent on Yak1 kinase and, consequently, in ethanol-grown yak1 cells the Bcy1 remained nuclear. A two-hybrid screen aimed to isolate genes encoding proteins that interact with the Bcy1 N-terminal domain identified Zds1. In ethanol-grown zds1 cells, cytoplasmic localization of Bcy1 was largely absent, while overexpression of ZDS1 led to increased cytoplasmic Bcy1 localization. Zds1 does not regulate Bcy1 modification since this was found to be unaffected in zds1 cells. However, in zds1 cells cluster II-mediated, but not cluster I-mediated, cytoplasmic localization of Bcy1 was found to be absent. Altogether, these results suggest that Zds1-mediated cytoplasmic localization of Bcy1 is regulated by carbon source-dependent phosphorylation of cluster II serines, while cluster I acts in a Zds1-independent manner.


Figures

FIG. 1
FIG. 1
Western analysis of extracts from yeast cells producing wild-type and mutant versions of HA-tagged Bcy1. (A) Extracts of strain MR1 transformed with 313pBHB1–416 and 313pBHB125–416 grown to stationary phase after growth on glucose. Samples were drawn at various cell densities as indicated by their optical densities at 600 nm. (B) Extracts isolated from the strains as referred to in Panel A grown on YP medium supplemented with glucose (D), acetate (Ac), ethanol (Et), or glycerol (Gl). (C) Extracts from strain W303-1A transformed with 33AGHB1–124. Samples were drawn from cultures grown logarithmically on YPD (D, lanes 1 to 3) and from stationary-phase cultures (STAT, lanes 4 to 6). Some extracts were treated with phosphatase in the presence or absence of inhibitors before loading on the gel. PPase, λ phosphatase; Inh, λ phosphatase inhibitors (20 mM vanadate and 50 mM NaF). (D) Phosphatase treatment of extracts isolated from the strains referred to in panel C grown on YP-ethanol (Et).
FIG. 2
FIG. 2
Subcellular fractionation of cells grown on glucose (D)- and ethanol (Et)-based media. (A) Strain MR1 transformed with 313pBHBwt (WT) and 313pB(NLS)HBwt (WT-NLS). In lanes 1 to 3, the cytoplasmic fraction (CP) and in lanes 4 to 6, the nuclear fraction (N) were loaded. (B) Phosphatase treatment of the sample loaded in lane 2 of panel A.
FIG. 3
FIG. 3
Characterization of cluster I and II substitution mutants. (A) Schematic representation of the domain structure of Bcy1. Residues 1 to 124 comprise the targeting domain necessary and sufficient for nutrient-controlled localization. The catalytic subunits associate with the hinge region; two cAMP-binding domains are present in the C-terminal region. “I” and “II” indicate the location of clusters I and II. The primary structure of the cluster I and II serine-rich regions is shown. The serines replaced in cluster I and cluster II are indicated with numbers in subscript. (B) Western analysis of extracts from yeast strain W303-1A transformed with 33AGHB1–124, 33AGHB(1–124, Ser cluster I Ala), 33AGHB(1–124, Ser cluster II Ala), and 33AGHB(1–124, Ser cluster I+II Ala) designated by WT, cluster I, cluster II, and cluster I+II, respectively. Cells were harvested from cultures growing on YP medium supplemented with glucose (D) or ethanol (Et) or grown on YPD to stationary phase (STAT). (C) Fluorescence microscopy of ethanol-grown MR1 cells transformed with 33pBGHBwt and 33pBGHB(Ser cluster I+II Ala) encoding GFP-Bcy1wt and GFP-Bcy1(Ser cluster I+II Ala), respectively. (D) Quantification of the localization pattern of MR1 cells transformed with 33pBGHBwt, 33pBGHB(Ser cluster I Ala), 33pBGHB(Ser cluster II Ala), and 33pBGHB(Ser cluster I+II Ala) encoding the corresponding versions of Bcy1 as indicated. The mean percentage of ethanol-grown cells with nuclear fluorescence stronger than cytoplasmic fluorescence was determined. Three independent transformants were assayed at least three times each (at least 100 cells were counted for each determination). The error bars indicate the standard deviation. (E) Fluorescence microscopy of glucose-grown W303-1A cells transformed with 195A2-pBGHBwt, 195A2-pBGHB(Ser cluster I Asp), 195A2-pBGHB(Ser cluster II Asp), and 195A2-pBGHB(Ser cluster I+II Asp) encoding the corresponding versions of GFP-Bcy1 as indicated. (F) Quantification of the localization pattern of W303-1A transformants shown in panel E. Three patterns of localization were distinguished. N+ (black bars), cells with nuclear accumulation of GFP-Bcy1 with no detectable cytoplasmic fluorescence; N+/C (gray bars), cells with nuclear accumulation of GFP-Bcy1 but with cytoplasmic fluorescence detectable; N/C (open bars), cells with fluorescence evenly distributed over the nucleus and cytoplasm. Three independent transformants were assayed at least three times each (at least 100 cells were counted for each determination). The error bars indicate the standard deviation.
FIG. 3
FIG. 3
Characterization of cluster I and II substitution mutants. (A) Schematic representation of the domain structure of Bcy1. Residues 1 to 124 comprise the targeting domain necessary and sufficient for nutrient-controlled localization. The catalytic subunits associate with the hinge region; two cAMP-binding domains are present in the C-terminal region. “I” and “II” indicate the location of clusters I and II. The primary structure of the cluster I and II serine-rich regions is shown. The serines replaced in cluster I and cluster II are indicated with numbers in subscript. (B) Western analysis of extracts from yeast strain W303-1A transformed with 33AGHB1–124, 33AGHB(1–124, Ser cluster I Ala), 33AGHB(1–124, Ser cluster II Ala), and 33AGHB(1–124, Ser cluster I+II Ala) designated by WT, cluster I, cluster II, and cluster I+II, respectively. Cells were harvested from cultures growing on YP medium supplemented with glucose (D) or ethanol (Et) or grown on YPD to stationary phase (STAT). (C) Fluorescence microscopy of ethanol-grown MR1 cells transformed with 33pBGHBwt and 33pBGHB(Ser cluster I+II Ala) encoding GFP-Bcy1wt and GFP-Bcy1(Ser cluster I+II Ala), respectively. (D) Quantification of the localization pattern of MR1 cells transformed with 33pBGHBwt, 33pBGHB(Ser cluster I Ala), 33pBGHB(Ser cluster II Ala), and 33pBGHB(Ser cluster I+II Ala) encoding the corresponding versions of Bcy1 as indicated. The mean percentage of ethanol-grown cells with nuclear fluorescence stronger than cytoplasmic fluorescence was determined. Three independent transformants were assayed at least three times each (at least 100 cells were counted for each determination). The error bars indicate the standard deviation. (E) Fluorescence microscopy of glucose-grown W303-1A cells transformed with 195A2-pBGHBwt, 195A2-pBGHB(Ser cluster I Asp), 195A2-pBGHB(Ser cluster II Asp), and 195A2-pBGHB(Ser cluster I+II Asp) encoding the corresponding versions of GFP-Bcy1 as indicated. (F) Quantification of the localization pattern of W303-1A transformants shown in panel E. Three patterns of localization were distinguished. N+ (black bars), cells with nuclear accumulation of GFP-Bcy1 with no detectable cytoplasmic fluorescence; N+/C (gray bars), cells with nuclear accumulation of GFP-Bcy1 but with cytoplasmic fluorescence detectable; N/C (open bars), cells with fluorescence evenly distributed over the nucleus and cytoplasm. Three independent transformants were assayed at least three times each (at least 100 cells were counted for each determination). The error bars indicate the standard deviation.
FIG. 4
FIG. 4
Localization and modification of Bcy1 in different yeast mutants. (A) Western analysis of extracts isolated from mutant cells transformed with 33AGHB1–124. Prior to harvesting, cells were grown on ethanol (Et) or on YPD to stationary phase (STAT). Different exposures of the Western blot carried out with extracts of ethanol-grown cells are shown. (B) Fluorescence microscopy of ethanol-grown cells transformed with 195A2-pBGHBwt. Relevant genotypes of the different strains are indicated at the left. (C) Quantification of the localization pattern of the different strains shown in panel B. The percentage of ethanol-grown cells with stronger nuclear fluorescence compared to the cytoplasmic fluorescence was assayed. Three independent transformants were assayed at least three times each (at least 100 cells were counted for each determination). The error bars indicate the standard deviation. (D) Fluorescence microscopy of ethanol-grown msn2 msn4 yak1 mutant cells transformed with 195A2-pBGHB(Ser cluster I+II Asp).
FIG. 5
FIG. 5
Localization of GFP-Bcy1 as a function of Zds1 or Zds2. (A) Fluorescence microscopy of zds mutants transformed with 195A2-pBGHBwt. Fluorescence was determined from cells grown on YP plus glucose (YPD) or ethanol (YPE) and from cells in stationary phase (STAT). The relevant genotypes of the different strains are indicated. (B) Quantification of the localization pattern of the different strains shown in panel A. The percentage of ethanol-grown cells with stronger nuclear fluorescence compared to the cytoplasmic fluorescence was determined. Three independent transformants were assayed at least three times each (at least 100 cells were counted for each determination). The error bars indicate the standard deviation. (C) Quantification of the results of fluorescence microscopy with ethanol-grown cells transformed with 195A2-pBGHBwt. Relevant genotypes of the different strains are indicated at the left. Cells were cotransformed with either control plasmid pRS316 (indicated by vector, black bars) or plasmid 316pADH-ZDS1 (indicated by pADH-ZDS1, open bars), the latter encoding Zds1, whose production is regulated by the ADH1 promoter. Three independent transformants were assayed at least three times each (at least 100 cells were counted for each determination). The error bars indicate the standard deviation.
FIG. 6
FIG. 6
Functional interactions of Zds1 with Bcy1 versions mutated in their N-terminal domains. (A) Western analysis of extracts isolated from wild-type and zds1 cells transformed with 33AGHB1–124. Prior to harvesting, cells were grown on ethanol (Et) or YPD to stationary phase (STAT). (B) Fluorescence microscopy of glucose-grown W303-1A and zds1 cells transformed with 195A2-pBGHBwt, 195A2-pBGHB(Ser cluster I Asp), and 195A2-pBGHB(Ser cluster II Asp) encoding GFP fused to Bcy1, Bcy1(Ser cluster I Asp), and Bcy1(Ser cluster II Asp), respectively. (C) Quantification of the localization pattern shown in panel B. The percentage of glucose-grown W303-1A (black bars) and zds1 cells (open bars) with stronger nuclear fluorescence relative to cytoplasmic fluorescence was determined. Three independent transformants were assayed at least three times each (at least 100 cells were counted for each determination). The error bars indicate the standard deviation.
FIG. 7
FIG. 7
Working model of localization of Bcy1 regulated by phosphorylation. Phosphorylation of cluster I or II serines is required for cytoplasmic localization of Bcy1 and is regulated by Yak1. Phosphorylation may stimulate export of nuclear Bcy1 (model A). Alternatively, phosphorylation of de novo-synthesized Bcy1 might trigger cytoplasmic retention or may inhibit its nuclear import (model B). Cluster II-mediated cytoplasmic localization of Bcy1 requires Zds1. A functional interaction between Bcy1 and Zds1 is dependent on phosphorylation of cluster II serines but not of cluster I serines. PKA (Bcy1-Tpk1) controls its regulatory subunit localization. Expression of Yak1 is activated by Msn2 and Msn4, two transcription factors negatively regulated by PKA. In the presence of glucose, PKA activity is high, resulting in low YAK1 expression. During growth on nonfermentable carbon sources, lower PKA activity allows enhanced expression of YAK1, presumably resulting in high Yak1 kinase activity, leading to Bcy1 phosphorylation. Abbreviations: CP, cytoplasm; N, nucleus; I, Bcy1 cluster I (amino acid residues 3 to 9); II, Bcy1 cluster II (amino acid residues 74 to 84); (P), phosphate; X, hypothetical factor interacting with phosphorylated cluster I.

References

    1. Ausubel F M, Brent B, Kingston R E, Moore D D, Seidman J G, Smith J A, Struhl K, editors. Current protocols in molecular biology. New York, N.Y: Green Publishing Associates and Wiley Interscience; 1993.
    1. Beebe S J. The cAMP-dependent protein kinases and cAMP signal transduction. Semin Cancer Biol. 1994;5:285–294. - PubMed
    1. Bi E, Pringle J R. ZDS1 and ZDS2, genes whose products may regulate Cdc42p in Saccharomyces cerevisiae. Mol Cell Biol. 1996;16:5264–5275. - PMC - PubMed
    1. Bregman D B, Bhattacharyya N, Rubin C S. High affinity binding protein for the regulatory subunit of cAMP-dependent protein kinase II-B. Cloning, characterization, and expression of cDNAs for rat brain P150. J Biol Chem. 1989;264:4648–4656. - PubMed
    1. Colledge M, Scott J D. AKAPs: from structure to function. Trends Cell Biol. 1999;9:216–221. - PubMed

Publication types

MeSH terms