. 2001 Jan 2;98(1):31-6.
doi: 10.1073/pnas.98.1.31.

Model-based analysis of oligonucleotide arrays: expression index computation and outlier detection

Affiliations

Model-based analysis of oligonucleotide arrays: expression index computation and outlier detection

C Li et al. Proc Natl Acad Sci U S A. .

Abstract

Recent advances in cDNA and oligonucleotide DNA arrays have made it possible to measure the abundance of mRNA transcripts for many genes simultaneously. The analysis of such experiments is nontrivial because of large data size and many levels of variation introduced at different stages of the experiments. The analysis is further complicated by the large differences that may exist among different probes used to interrogate the same gene. However, an attractive feature of high-density oligonucleotide arrays such as those produced by photolithography and inkjet technology is the standardization of chip manufacturing and hybridization process. As a result, probe-specific biases, although significant, are highly reproducible and predictable, and their adverse effect can be reduced by proper modeling and analysis methods. Here, we propose a statistical model for the probe-level data, and develop model-based estimates for gene expression indexes. We also present model-based methods for identifying and handling cross-hybridizing probes and contaminating array regions. Applications of these results will be presented elsewhere.


Figures

Figure 1
Figure 1
Black curves are the PM and MM data of gene A in the first six arrays. Light curves are the fitted values to model 1. Probe pairs are labeled 1 to 20 on the horizontal axis.
Figure 2
Figure 2
Black curves are the PM–MM difference data of gene A in the first six arrays. Light curves are the fitted values to model 2.
Figure 3
Figure 3
Plots of residuals (y axis) versus fitted value (x axis) for additive model (A) and multiplicative model (B).
Figure 4
Figure 4
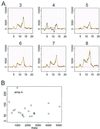
(A) Six arrays of probe set 1,248. (B) Plot of standard error (SE, y axis) vs. θ. The probe pattern (black curve) of array 4 is inconsistent with other arrays, leading to unsatisfactory fitted curve (light) and large standard errors of θ4.
Figure 5
Figure 5
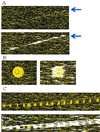
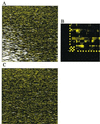
(A) A long scratch contamination (indicated by arrow) is alleviated by automatic outlier exclusion along this scratch. (B and C) Regional clustering of array outliers (white bars) indicates contaminated regions in the original images. These outliers are automatically detected and accommodated in the analysis. Note that some probe sets in the contaminated region are not marked as array outliers, because contamination contributed additively to PM and MM in a similar magnitude and thus cancel in the PM–MM differences, preserving the correct signals and probe patterns.
Figure 6
Figure 6
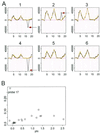
(A) Probe 17 of probe set 1,222 is not concordant with other probes (black arrows) and is numerically identified by the outstanding standard error of φ17 (B).
Figure 7
Figure 7
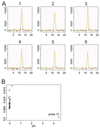
(A) Probe set 3,562 has a single high-leverage probe 12, and the fitted light curves almost coincide with the black data curve. (B) φ12 is large compared with other φs close-to-zero value. Note that Affymetrix's superscoring method works here by consistently excluding this probe.
Figure 8
Figure 8
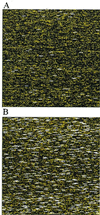
(A) A typical array (array 5) with array outliers (white bars) and single outliers (red dots) marked. (B) Array 4 has an unusually large number of array and single outliers, indicative of possible sample contamination.
Figure 9
Figure 9
(A) Array 9 initially has an unusually large number of array and single outliers in the lower-left region. (B) The lower-left corner pixel position (white dot) appears to be off by about one feature and therefore leads to incorrect gridding and averaging of many features in the lower-left region. This is hard to detect by visual inspection of the original image. (C) After manually setting the correct corner pixel position, the array is salvaged.
Figure 10
Figure 10
The outlier image of an intentionally misplaced murine array in a set of human arrays (4,647 array outliers and 905 single outliers detected).
Figure 11
Figure 11
Histograms of percent of probe used (A), explained energy (B), and presence percentage (C) for all 7,129 probe sets. As seen from C most genes are only present in a few arrays.
Figure 12
Figure 12
Boxplots of probe usage (A) and explained energy (B) stratified by presence percentage (the number of presences of a gene in 21 arrays and the subpopulation size for the 6 boxplots are: 0–3, 4,365; 4–7, 817; 8–11, 567; 12–15, 520; 16–19, 518; and 20–21, 342). When presence percentage is high, the excluded probes tend to be cross-hybridizing probes; when presence percentage is low, PM–MM differences fluctuating around 0 may result in many negative probes and exclusion of them. As more arrays enter the database, we may reuse these probes if they respond positively to target expressions. The more arrays in which a target gene is present, the better the explained energy.

Similar articles

Cited by

References

    1. Lockhart D, Dong H, Byrne M, Follettie M, Gallo M, Chee M, Mittmann M, Wang C, Kobayashi M, Horton H, et al. Nat Biotechnol. 1996;14:1675–1680. - PubMed
    1. Lipshutz R J, Fodor S, Gingeras T, Lockhart D. Nat Genet, supplement. 1999;21:20–24. - PubMed
    1. Tamayo P, Slonim D, Mesirov J, Zhu Q, Kitareewan S, Dmitrovsky E, Lander E S, Golub T R. Proc Natl Acad Sci USA. 1999;96:2907–2912. - PMC - PubMed
    1. Alon U, Barkai N, Notterman D A, Gish K, Ybarra S, Mack D, Levine A J. Proc Natl Acad Sci USA. 1999;96:6745–6750. - PMC - PubMed
    1. Wodicka L, Dong H, Mittmann M, Ho M, Lockhart D. Nat Biotechnol. 1997;15:1359–1367. - PubMed

Publication types