. 2001 Jan 2;98(1):218-23.
doi: 10.1073/pnas.98.1.218.

Genome-wide analysis of developmental and sex-regulated gene expression profiles in Caenorhabditis elegans

Affiliations

Genome-wide analysis of developmental and sex-regulated gene expression profiles in Caenorhabditis elegans

M Jiang et al. Proc Natl Acad Sci U S A. .

Abstract

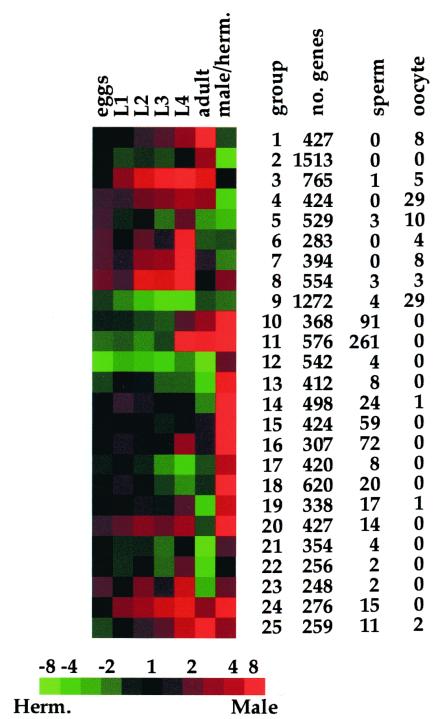
We have constructed DNA microarrays containing 17,871 genes, representing about 94% of the 18,967 genes currently annotated in the Caenorhabditis elegans genome. These DNA microarrays can be used as a tool to define a nearly complete molecular profile of gene expression levels associated with different developmental stages, growth conditions, or worm strains. Here, we used these full-genome DNA microarrays to show the relative levels of gene expression for nearly every gene during development, from eggs through adulthood. These expression data can help reveal when a gene may act during development. We also compared gene expression in males to that of hermaphrodites and found a total of 2,171 sex-regulated genes (P < 0.05). The sex-regulated genes provide a global view of the differences between the sexes at a molecular level and identify many genes likely to be involved in sex-specific differentiation and behavior.


Figures

Figure 1
Figure 1
A global profile of gene expression during development. Of the entire set of 17,871 genes, 12,486 showed at least a 2-fold difference in expression during development or in the two sexes. The noncentered Pearson correlation was calculated between each pair-wise combination of these genes and used to place them into a self-organizing map with 25 nodes (a 5 × 5 grid) using 105 reiterations. Details about the self-organizing map and its source code can be found at http://genome-www.stanford.edu/∼sherlock/cluster.html. The total number of genes, the number of sperm-enriched genes, and the number of oocyte-enriched genes in each group are shown. A detailed list of the genes in each expression group can be found at http://cmgm.stanford.edu/∼kimlab/dev. For the developmental time course, samples from developmental stages are compared with reference RNA, and for sex regulation, samples from males are compared with those from hermaphrodites. Red indicates more abundant than the reference RNA or enriched in males. Green indicates less abundant than the reference RNA or hermaphrodite enriched. Scale shows level of expression (fold expression) as varying shades of color.
Figure 2
Figure 2
Developmental expression of cyclin genes. blast searches of the current sequence in the C. elegans genome identified seven cyclin genes. Developmental expression levels are normalized such that each stage is compared with the stage with the lowest level. Scale shows level of expression.
Figure 3
Figure 3
Developmental expression of Rb complex genes. Genes that encode proteins similar to mammalian proteins in the core Rb complex are shown in blue. The hierarchical tree shows the degree of similarity of the expression patterns. Developmental expression levels are normalized, such that each stage is compared with the stage with the lowest level. Scale shows level of expression.
Figure 4
Figure 4
Developmental expression of Wnt signaling genes. The hierarchical tree shows the degree of similarity of the expression patterns. The embryonic expression group is shown in blue, and the larval expression group is shown in green. Developmental expression levels are normalized, such that each stage is compared with the stage with the lowest level. Scale shows level of expression.

References

    1. C. elegans Sequencing Consortium. Science. 1998;282:2012–2018. - PubMed
    1. Costanzo M C, Hogan J D, Cusick M E, Davis B P, Fancher A M, Hodges P E, Kondu P, Lengieza C, Lew-Smith J E, Lingner C, et al. Nucleic Acids Res. 2000;28:73–76. - PMC - PubMed
    1. Walhout A J, Sordella R, Lu X, Hartley J L, Temple G F, Brasch M A, Thierry M N, Vidal M. Science. 2000;287:116–122. - PubMed
    1. Eisen M B, Spellman P T, Brown P O, Botstein D. Proc Natl Acad Sci USA. 1998;95:14863–14868. - PMC - PubMed
    1. Schena M, Shalon D, Davis R W, Brown P O. Science. 1995;270:467–470. - PubMed

Publication types

MeSH terms