. 2001 Feb 5;430(2):235-49.
doi: 10.1002/1096-9861(20010205)430:2<235::aid-cne1028>3.0.co;2-p.

Emergence of ocular dominance columns in cat visual cortex by 2 weeks of age

Affiliations

Emergence of ocular dominance columns in cat visual cortex by 2 weeks of age

M C Crair et al. J Comp Neurol. .

Abstract

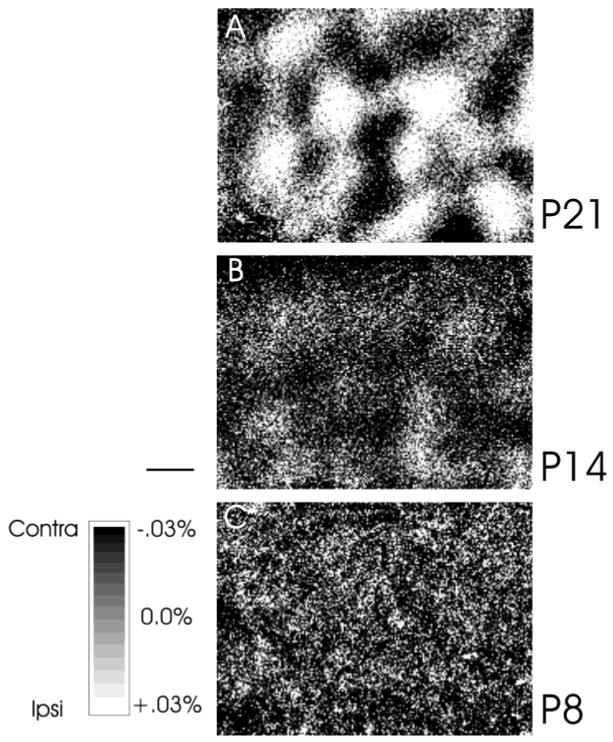
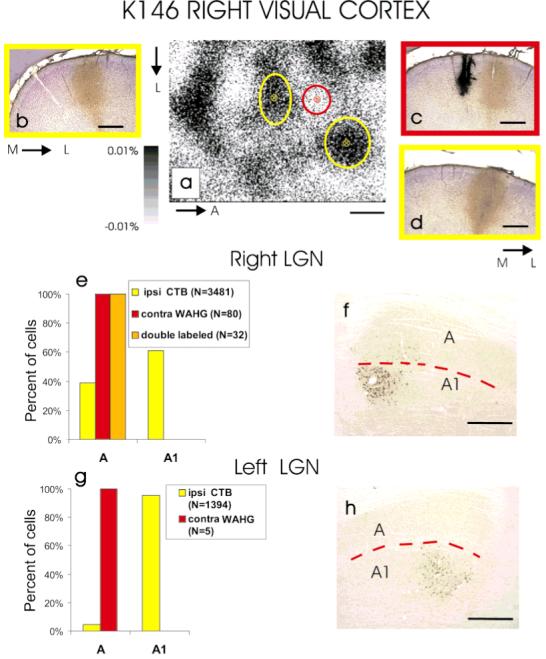
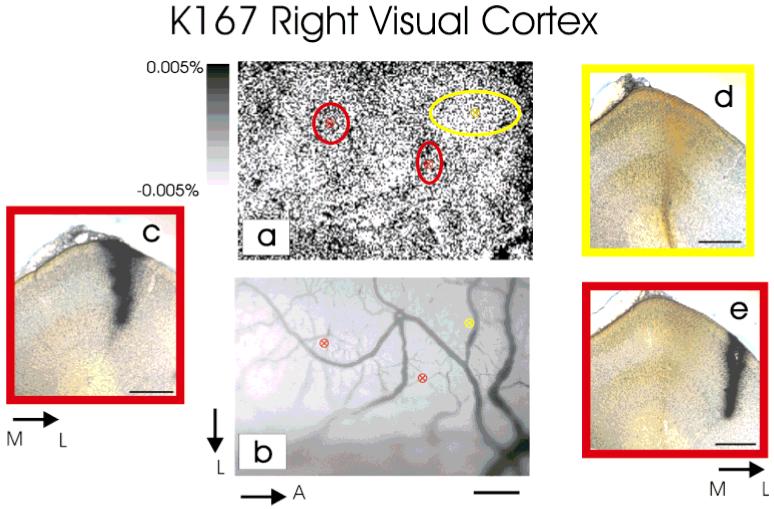
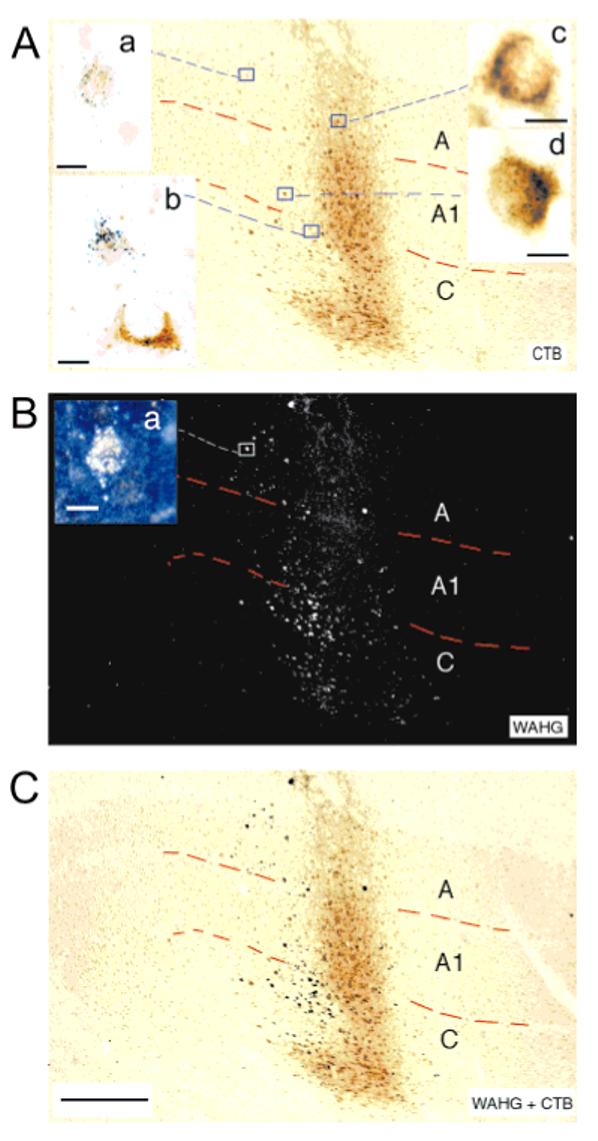
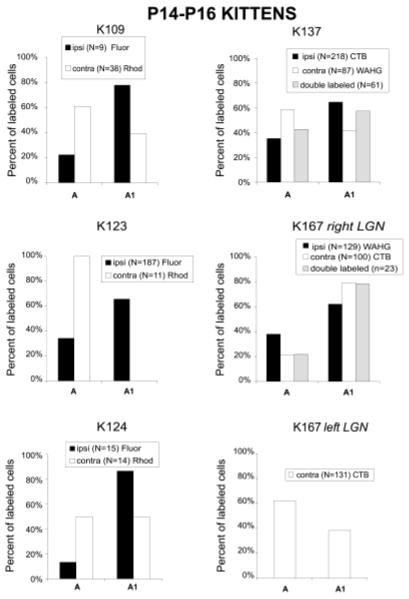
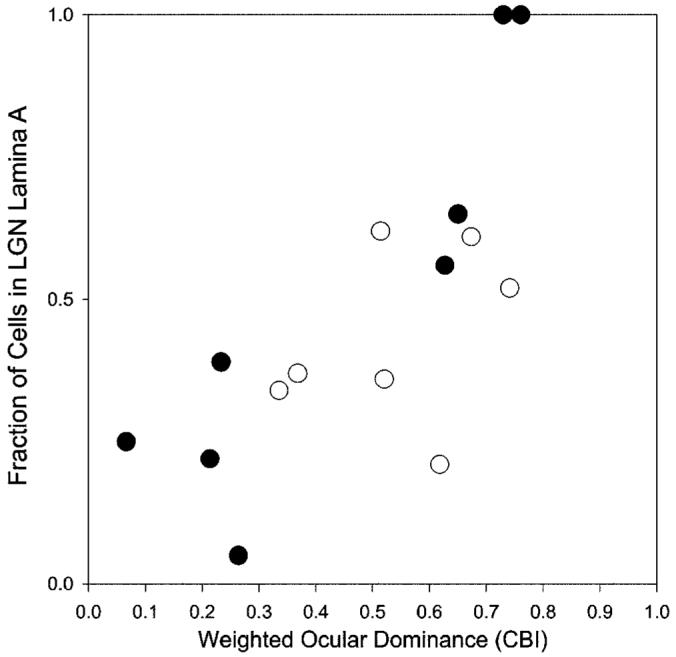
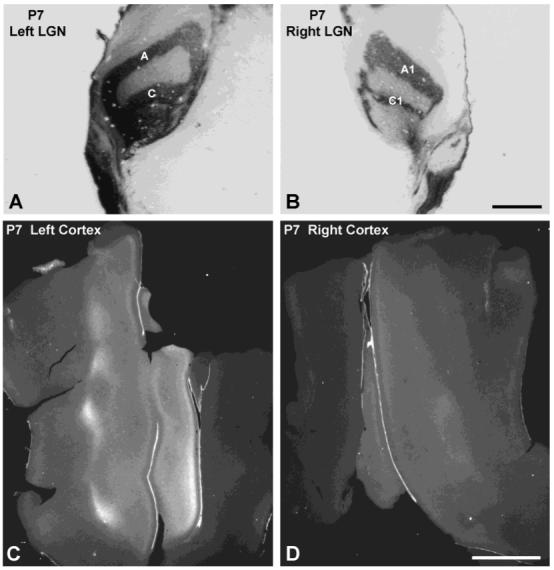
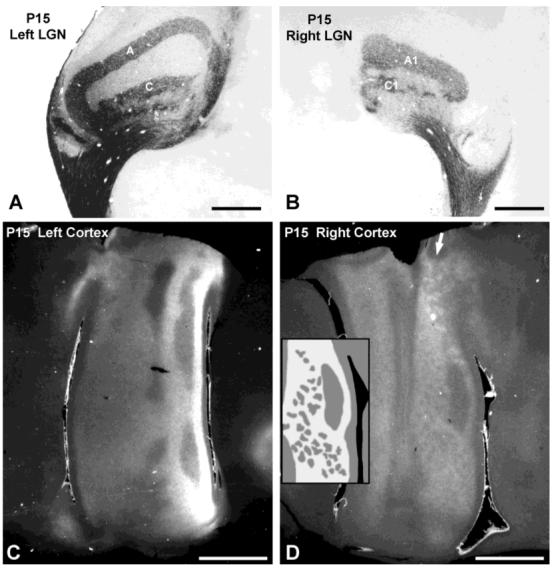
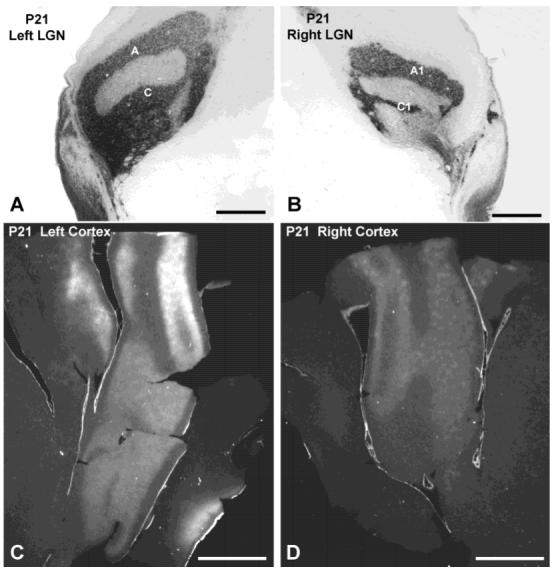
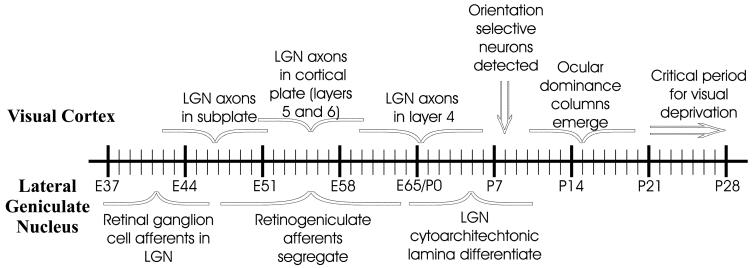
Previous anatomic studies of the geniculocortical projection showed that ocular dominance columns emerge by 3 weeks of age in cat visual cortex, but recent optical imaging experiments have revealed a pattern of physiologic eye dominance by the end of the second week of life. We used two methods to search for an anatomic correlate of this early functional ocular dominance pattern. First, retrograde labeling of lateral geniculate nucleus (LGN) inputs to areas of cortex preferentially activated by one eye showed that the geniculocortical projection was already partially segregated by eye at postnatal day 14 (P14). Second, transneuronal label of geniculocortical afferents in flattened sections of cortex after a tracer injection into one eye showed a periodic pattern at P14 but not at P7. In the classic model for the development of ocular dominance columns, initially overlapping geniculocortical afferents segregate by means of an activity-dependent competitive process. Our data are consistent with this model but suggest that ocular dominance column formation begins between P7 and P14, approximately a week earlier than previously believed. The functional and anatomic data also reveal an early developmental bias toward contralateral eye afferents. This initial developmental bias is not consistent with a strictly Hebbian model for geniculocortical afferent segregation. The emergence of ocular dominance columns before the onset of the critical period for visual deprivation also suggests that the mechanisms for ocular dominance column formation may be partially distinct from those mediating plasticity later in life.


Figures

Fig. 1
Fig. 1
Optical imaging of intrinsic signals from the visual cortex of young cats at postnatal day 21 (P21) (A), P14 (B), and P8 (C). Responses through the contralateral eye are shown as darker areas. Distinct ocular dominance columns (light and dark patches) are present at P21. In cats a week younger (P14), eye-specific responses (light areas are ipsilateral eye patches) are emerging, although the cortex is dominated by responses through the contralateral eye (dark areas). No ocular dominance pattern is visible in a P8 cat (C), and the response is biased toward the contralateral eye (dark). Gray response scale applies to all images, which are not smoothed. Scale bar = 500 μm.
Fig. 2
Fig. 2
Retrograde labeling in the lateral geniculate nucleus (LGN) of an adult cat after targeted tracer injections into the right and left eye ocular dominance patches. a: Optical image of intrinsic signals from a 3.2 × 2.4 mm area of the right visual cortex showing clear ocular dominance (OD) patches activated through the contralateral (white areas) and ipsilateral (dark areas) eyes. A wheat germ apo-horseradish peroxidase gold (WAHG) injection (red ellipse on the optical image a, and c) and two cholera toxin B (CTB) injections (yellow ellipses on the optical image a, and b,d) were targeted to the contralateral and ipsilateral eye OD patches, respectively. The size of the ellipses centered at each injection site indicates the spread of the tracer as assessed histologically. b-d: Coronal sections through the lateral gyrus showing the spread of the tracers at the injection sites. e: Laminar distribution of retrogradely labeled neurons in the right LGN. Note that WAHG labeled neurons are restricted to lamina A, consistent with the small injection site in the cortex (red ellipse on the optical OD map a, and c). Because of the spread of the CTB at the injection sites (yellow ellipses in the optical OD map a, and b,d), the CTB-labeled neurons in the LGN are not restricted to lamina A1 (e,f). g,h: In the left hemisphere, the injected tracers were confined to eye-specific OD columns and retrogradely labeled neurons were restricted to the appropriate LGN lamina. M, medial, L, lateral; A, anterior. The red dotted lines in f and h mark the border between LGN laminae A and A1. Scale bars = 500 μm.
Fig. 3
Fig. 3
a: Optical image of intrinsic signals in the right visual cortex of a P16 cat. Ocular dominance columns are just emerging at this age, as shown by the faint fluctuations in the optical map. b: Vascular pattern of the imaged area guiding the injections of retrograde tracers. Two injections of wheat germ apo-horseradish peroxidase gold (WAHG) were made into areas that responded preferentially to the ipsilateral eye (a: red ellipses centered onto darker areas; insets c,e), and one injection of cholera toxin B was made into a region responding preferentially to the contralateral eye (a: yellow ellipse centered onto a white area; inset d). In a, the size of the ellipses centered at each injection site indicates the spread of the tracer as assessed histologically. c-e: Coronal sections through the lateral gyrus showing the spread of the tracers at the injection sites. Scale bars = 500 μm for a-e.
Fig. 4
Fig. 4
Sagittal section through the lateral geniculate nucleus of a postnatal day 16 cat (K137) viewed in brightfield for cholera toxin B (CTB) labeling (A) and in darkfield for wheat germ apo-horseradish peroxidase gold (WAHG) labeling (B). CTB was injected into ipsilateral eye patches in cortex, and WAHG was injected into contralateral patches. C: A superimposition in Photoshop of the brightfield image and the inverted darkfield image. The insets show, at high magnification, the appearance of neurons retrogradely labeled with CTB (inset c), with WAHG (insets a,b in A, a in B; insets a show the same cell in brightfield and darkfield, respectively). Double-labeled neurons are shown at high magnification in A, inset b (bottom neuron), and inset d. Scale bars = 500 μm for A-C; 10 μm for insets a-d.
Fig. 5
Fig. 5
Histograms of the distribution of retrogradely labeled neurons in eye-specific lateral geniculate nucleus (LGN) laminae in postnatal day 14-16 cats. The inset within each histogram indicates the type of tracers and the intended ipsilateral (ipsi) or contralateral (contra) cortical ocular dominance (OD) domain in which the tracers were injected. The white bars represent the percentage of retrogradely labeled neurons found in laminae A and A1 when the retrograde tracer was injected into the contralateral eye OD patches. The black bars represent the percentage of neurons found in laminae A or A1 when the retrograde tracer was injected into the ipsilateral eye OD patches. Fluor, fluorescein; Rhod, rhodamine; CTB, cholera toxin B; WAHG, wheat germ apo-horseradish peroxidase gold.
Fig. 6
Fig. 6
Relationship between ocular dominance at the injection site and the fraction of retrogradely labeled neurons located in lamina A in adult cats (P > 77, filled circles) and kittens (postnatal day 14 [P14]-16, open circles). Ocular dominance was measured from intrinsic signals images by the weighted CBI (see Materials and Methods section). Note that extreme values of afferent segregation were found in adults. LGN, lateral geniculate nucleus; CBI, Contralateral Bias Index.
Fig. 7
Fig. 7
Postnatal day 7 (P7) cat. A,B: Autoradiographs of coronal lateral geniculate nucleus (LGN) sections viewed with brightfield microscopy, showing dark label concentrated in appropriate laminae after [3H]proline injection into the right eye. C,D: Autoradiographs of single, flatmounted sections of visual cortex, viewed with darkfield microscopy, showing label in layer IV. The label, which appears bright in darkfield, was stronger in the left cortex. There were no columns apparent in either hemisphere, although the LGN laminae were distinct at this age. Scale bars = 1 mm in A,B; 5 mm in C,D.
Fig. 8
Fig. 8
Postnatal day 15 (P15) cat. A,B: Autoradiographs showing mature pattern of lamina specific label in lateral geniculate nucleus (LGN). C,D: In the contralateral (left) cortex, the ocular dominance columns are visible but difficult to illustrate. In the ipsilateral (right) cortex, they are much clearer. Areas of bright label in (D) represent zones receiving input from the ipsilateral eye; regions of darker label receive input predominately from the contralateral eye. Arrow indicates coarser columns in area 18. Inset in D is a drawing of the ocular dominance columns in the portion of area 17 immediately to the right; scale is the same as the photograph. Scale bars = 1 mm in A,B; 5 mm in C,D.
Fig. 9
Fig. 9
Postnatal day 21 (P21) cat. A,B: Lateral geniculate nucleus (LGN) autoradiographs. C,D: Columns are visible in both hemispheres, although they are more distinct on the ipsilateral (right) side. Scale bars = 1 mm in A,B; 5 mm in C,D.
Fig. 10
Fig. 10
Cat visual development time line. Major events in the development of visual cortex (top) and the lateral geniculate nucleus (LGN) (bottom). References for visual cortex development: Shatz and Luskin, 1986; Ghosh and Shatz, 1992; Hubel and Wiesel, , ; Albus and Wolf, 1984; Crair et al., 1998; Olson and Freeman, 1980. References for LGN development: Kalil, 1978; Shatz, 1983.

Similar articles

Cited by

References

    1. Albus K, Wolf W. Early post-natal development of neuronal function in the kitten’s visual cortex: a laminar analysis. J Physiol (Lond) 1984;348:153–185. - PMC - PubMed
    1. Antonini A, Stryker MP. Rapid remodeling of axonal arbors in the visual cortex. Science. 1993a;260:1819–1821. - PubMed
    1. Antonini A, Stryker MP. Development of individual geniculocortical arbors in cat striate cortex and effects of binocular impulse blockade. J Neurosci. 1993b;13:3549–3573. - PMC - PubMed
    1. Basbaum AI, Menetrey D. Wheat germ agglutinin-apoHRP gold: a new retrograde tracer for light- and electron-microscopic single- and double-label studies. J Comp Neurol. 1986;261:306–318. - PubMed
    1. Bolz J, Novak N, Staiger V. Formation of specific afferent connections in organotypic slice cultures from rat visual cortex cocultured with lateral geniculate nucleus. J Neurosci. 1992;12:3054–3070. - PMC - PubMed

Publication types

MeSH terms