

doi: 10.1073/pnas.98.2.581.
Epub 2001 Jan 2.
High-throughput development and characterization of a genomewide collection of gene-based single nucleotide polymorphism markers by chip-based matrix-assisted laser desorption/ionization time-of-flight mass spectrometry
Affiliations
- PMID: 11136232
- PMCID: PMC14630
- DOI: 10.1073/pnas.98.2.581
Item in Clipboard
High-throughput development and characterization of a genomewide collection of gene-based single nucleotide polymorphism markers by chip-based matrix-assisted laser desorption/ionization time-of-flight mass spectrometry
Proc Natl Acad Sci U S A.
.
Abstract
We describe here a system for the rapid identification, assay development, and characterization of gene-based single nucleotide polymorphisms (SNPs). This system couples informatics tools that mine candidate SNPs from public expressed sequence tag resources and automatically designs assay reagents with detection by a chip-based matrix-assisted laser desorption/ionization time-of-flight mass spectrometry platform. As a proof of concept of this system, a genomewide collection of reagents for 9,115 gene-based SNP genetic markers was rapidly developed and validated. These data provide preliminary insights into patterns of polymorphism in a genomewide collection of gene-based polymorphisms.
Figures
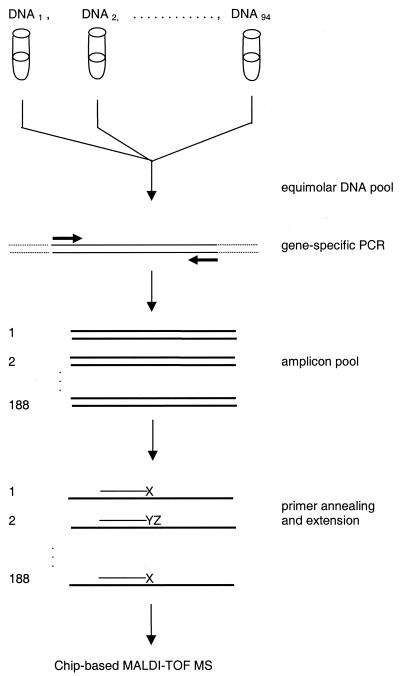
Scheme of the analytical process to confirm and validate SNPs using
chip-based mass spectrometry. After setup of an equimolar mixture of 94
individual Centre d'Étude du Polymorphisme Humain DNA samples,
gene-specific uniplex PCRs were performed. The amplicon pool was
subjected to a post-PCR primer extension reaction
(massextend ). Nanoliter amounts of the extension products
were loaded onto SpectroCHIPs and subsequently analyzed by an array
mass spectrometer.

Example spectra representing the range of assay qualities. Allelic
peaks are indicated at the top of each spectrum. (A)
Low-end assay quality, total peak area of both alleles (pa; arbitrary
units) = 768, signal-to-noise ratio (snr) = 24.7, relative
frequency for C allele = 0.23, T allele = 0.77, standard
deviation (SD) of four individual spottings onto SpectroCHIPs followed
by mass spectrometric analysis = 0.034. (B) pa
= 1,995, snr = 33.3, C allele = 0.37, T allele = 0.63,
SD = 0.012. (C) Average assay quality, pa =
9,957, snr = 77.4, C allele = 0.55, T allele = 0.45,
SD = 0.009. (D) High-end assay quality, pa =
48,679, snr = 199, C allele = 0.77, T allele = 0.23,
SD = 0.006.
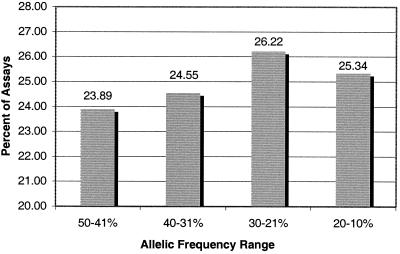
Allelic frequency range of 3,646 SNP genetic markers with a
frequency in the Centre d'Étude du Polymorphisme Humain
population greater than 10%.
References
-
- Risch N, Merikangas K. Science. 1996;273:1516–1517. - PubMed
-
- Buetow K H, Edmonson M N, Cassidy A B. Nat Genet. 1999;21:323–325. - PubMed
-
- Schuler G D, Boguski M S, Stewart E A, Stein L D, Gyapay G, Rice K, White R E, Rodriguez-Tome P, Aggarwal A, Bajorek E, et al. Science. 1996;274:540–546. - PubMed
-
- Hillier L D, Lennon G, Becker M, Bonaldo M F, Chiapelli B, Chissoe S, Dietrich N, DuBuque T, Favello A, Gish W, et al. Genome Res. 1996;6:807–828. - PubMed
-
- Braun A, Little D P, Koster H. Clin Chem (Washington, DC) 1997;43:1151–1158. - PubMed
Publication types
MeSH terms
Substances
LinkOut - more resources
Full Text Sources
Other Literature Sources
Medical
Research Materials
