

doi: 10.1073/pnas.98.1.22.
Genetics and the population history of Europe
Affiliations
- PMID: 11136246
- PMCID: PMC33353
- DOI: 10.1073/pnas.98.1.22
Item in Clipboard
Genetics and the population history of Europe
Proc Natl Acad Sci U S A.
.
Abstract
Analysis of genetic variation among modern individuals is providing insight into prehistoric events. Comparisons of levels and patterns of genetic diversity with the predictions of models based on archeological evidence suggest that the spread of early farmers from the Levant was probably the main episode in the European population history, but that both older and more recent processes have left recognizable traces in the current gene pool.
Figures
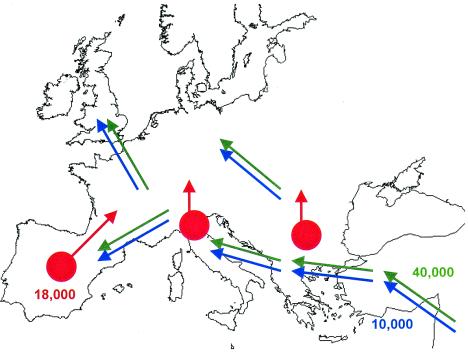
A scheme of the main demographic processes documented in the
archeological record of Europe. Numbers are approximate dates, in years
before the present. Green arrows, Paleolithic colonization; red arrows,
Mesolithic reexpansions (glacial refugia are represented by red
circles); blue arrows, Neolithic demic diffusion.
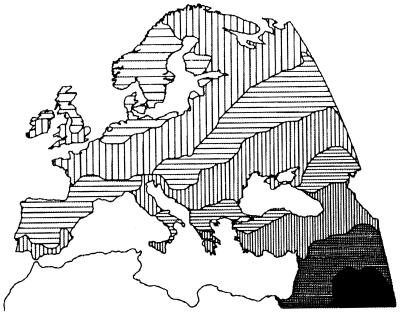
A summary of genetic variation in Europe: first principal component.
Different shades of gray represent different values of a synthetic
variable summarizing allele frequencies at 120 protein loci.
(Cavalli-Sforza, L. L., et al., The History and
Geography of Human Genes. Copyright © 1994 by PUP. Reprinted by
permission of Princeton University Press; ref. .)
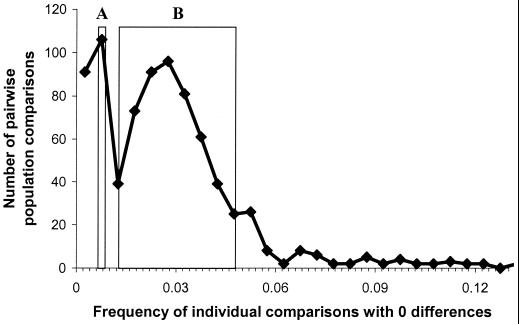
Observed frequency of identical sequences in 780 pairwise comparisons
of 40 European mitochondrial population samples. The two boxes refer to
the range of expected values, estimated assuming two rates
r of population growth (r = 0.005
and r = 0.008) and a Paleolithic (40,000 years ago;
box A) or a Neolithic (4,000 years ago; box B) separation of the gene
pools.
References
-
- Wolpoff M H, Wu X, Thorne A G. In: The Origins of Modern Humans: A World Survey of the Fossil Evidence. Smith F H, Spencer F, editors. New York: Liss; 1984. pp. 411–483.
-
- Stringer C B, Andrews P. Science. 1988;239:1263–1268. - PubMed
-
- Krings M, Stone A, Schmitz R W, Krainitzki H, Stoneking M, Pääbo S. Cell. 1997;90:19–30. - PubMed
-
- Ovchinnikov I V, Götherström A, Romanova G P, Kharitonov V, Lidén K, Goodwin W. Nature (London) 2000;404:490–493. - PubMed
-
- Lahr M M. J Hum Evol. 1994;26:23–56.
MeSH terms
Substances
LinkOut - more resources
Full Text Sources
