. 2001 Jan 1;193(1):51-60.
doi: 10.1084/jem.193.1.51.

Specific migratory dendritic cells rapidly transport antigen from the airways to the thoracic lymph nodes

Affiliations

Specific migratory dendritic cells rapidly transport antigen from the airways to the thoracic lymph nodes

K Y Vermaelen et al. J Exp Med. .

Abstract

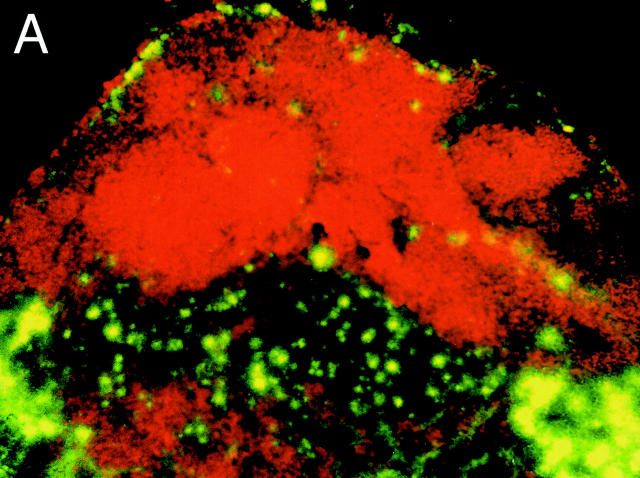
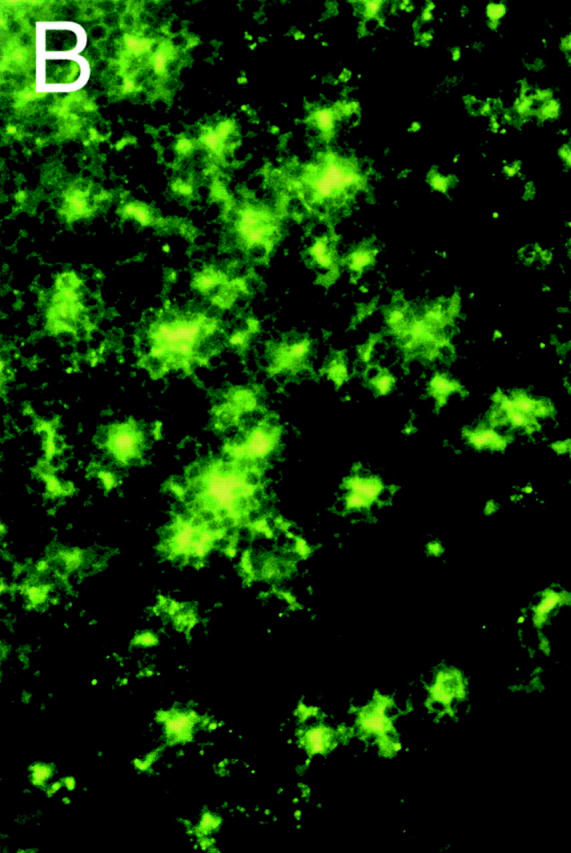
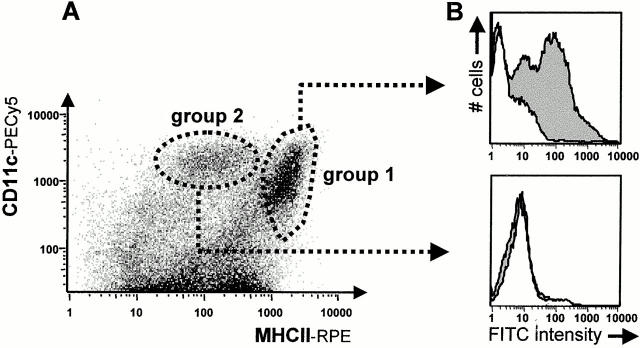
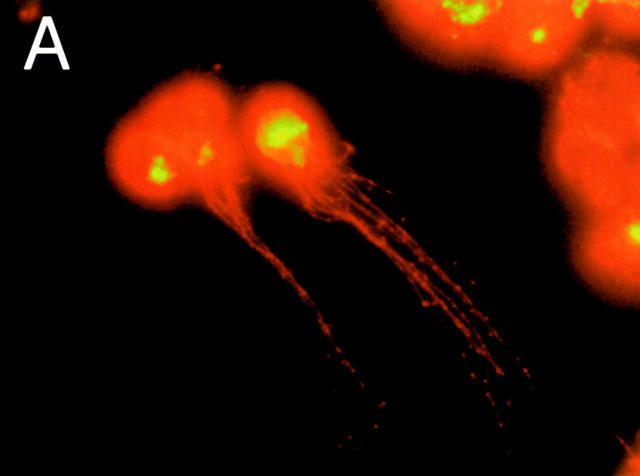
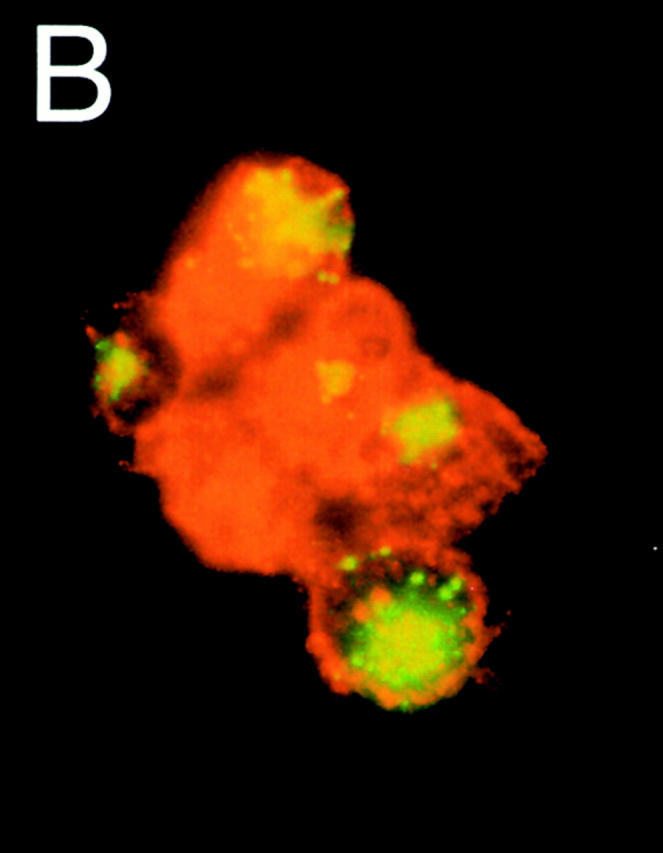
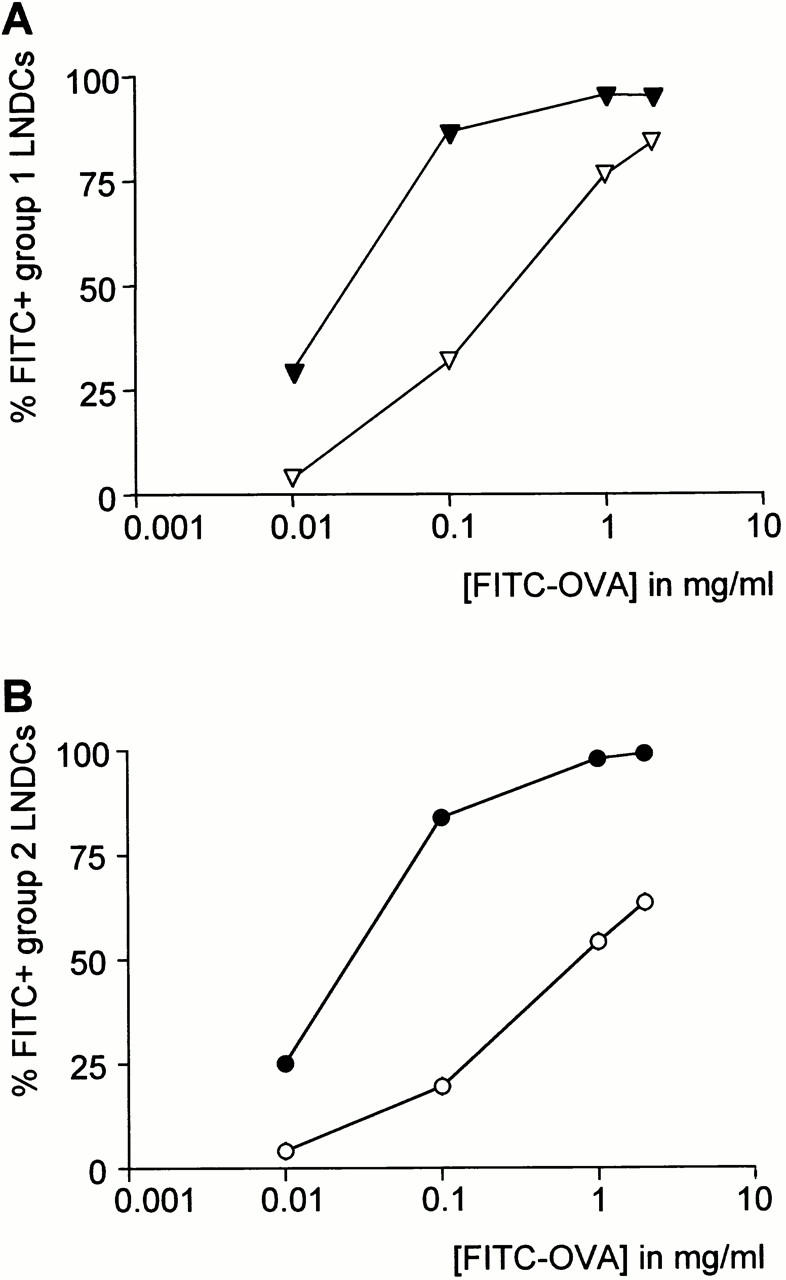
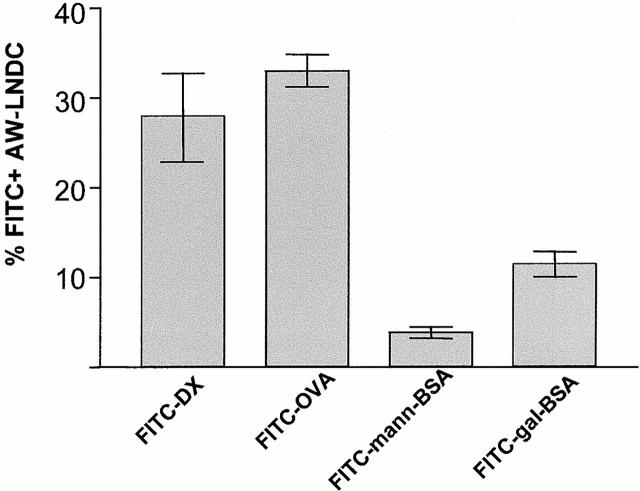
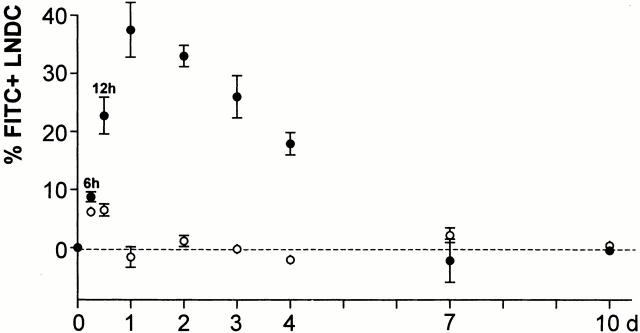
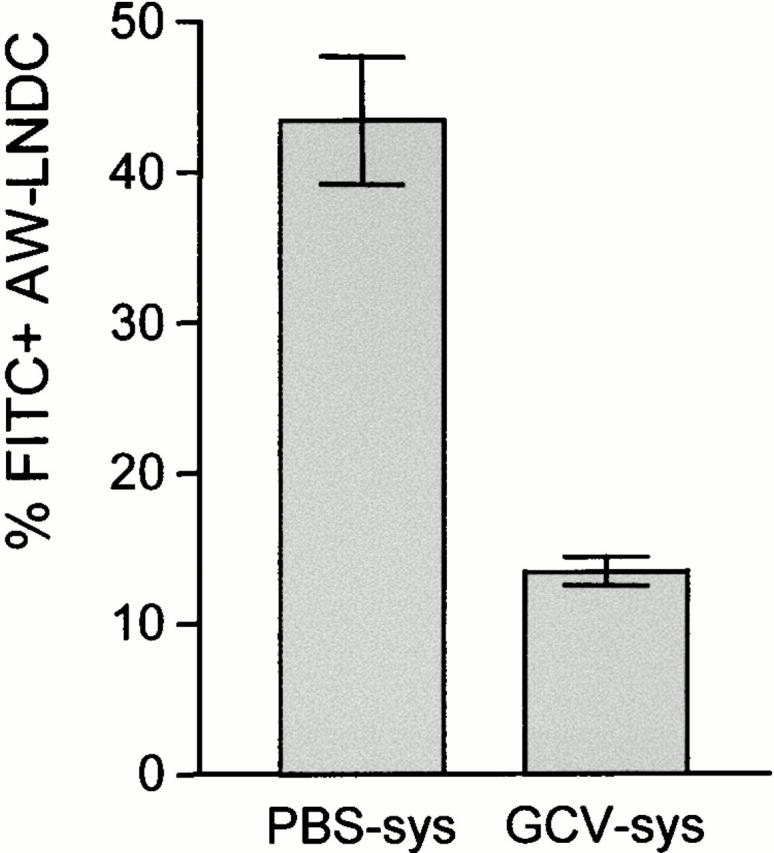
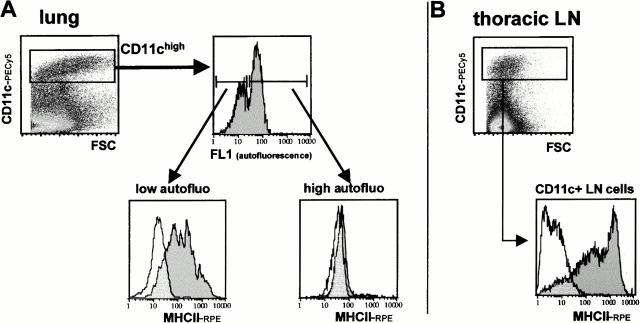
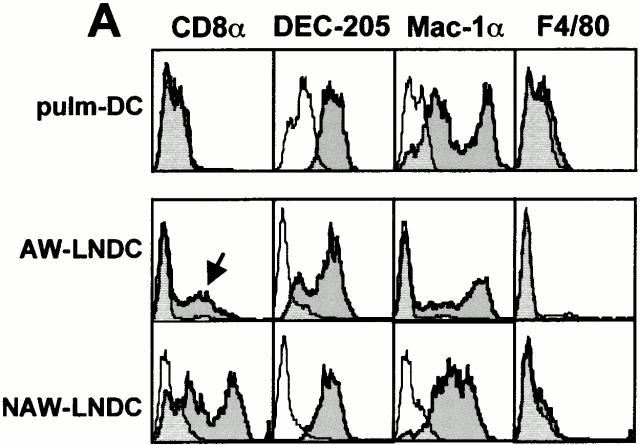
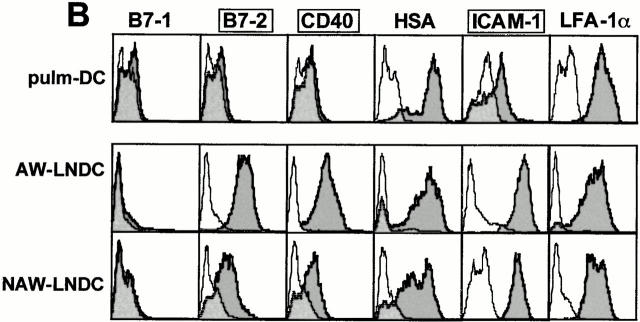
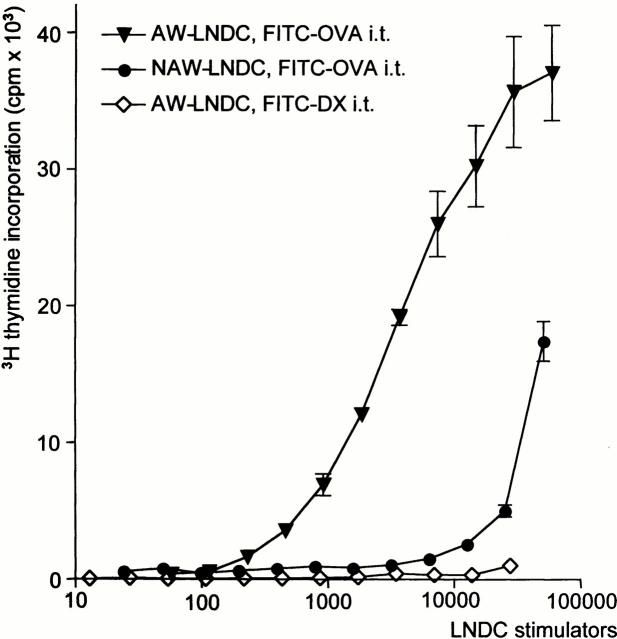
Antigen transport from the airway mucosa to the thoracic lymph nodes (TLNs) was studied in vivo by intratracheal instillation of fluorescein isothiocyanate (FITC)-conjugated macromolecules. After instillation, FITC(+) cells with stellate morphology were found deep in the TLN T cell area. Using flow cytometry, an FITC signal was exclusively detected in CD11c(med-hi)/major histocompatibility complex class II (MHCII)(hi) cells, representing migratory airway-derived lymph node dendritic cells (AW-LNDCs). No FITC signal accumulated in lymphocytes and in a CD11c(hi)MHCII(med) DC group containing a CD8 alpha(hi) subset (non-airway-derived [NAW]-LNDCs). Sorted AW-LNDCs showed long MHCII(bright) cytoplasmic processes and intracytoplasmatic FITC(+) granules. The fraction of FITC(+) AW-LNDCs peaked after 24 h and had reached baseline by day 7. AW-LNDCs were depleted by 7 d of ganciclovir treatment in thymidine kinase transgenic mice, resulting in a strong reduction of FITC-macromolecule transport into the TLNs. Compared with intrapulmonary DCs, AW-LNDCs had a mature phenotype and upregulated levels of MHCII, B7-2, CD40, and intracellular adhesion molecule (ICAM)-1. In addition, sorted AW-LNDCs from FITC-ovalbumin (OVA)-instilled animals strongly presented OVA to OVA-TCR transgenic T cells. These results validate the unique sentinel role of airway DCs, picking up antigen in the airways and delivering it in an immunogenic form to the T cells in the TLNs.


Figures

Figure 1
Figure 1
TLN cryostat section from a DX-FITC–instilled mouse, as seen under fluorescence microscopy. (A) Staining with the B cell marker B220 (red): FITC+ cells are confined to the B cell–negative, paracortical T cell–dependent zones. (B) High power magnification of the paracortical zone showing numerous infiltrating FITC+ cells with a stellate morphology.
Figure 1
Figure 1
TLN cryostat section from a DX-FITC–instilled mouse, as seen under fluorescence microscopy. (A) Staining with the B cell marker B220 (red): FITC+ cells are confined to the B cell–negative, paracortical T cell–dependent zones. (B) High power magnification of the paracortical zone showing numerous infiltrating FITC+ cells with a stellate morphology.
Figure 2
Figure 2
(A) Flow cytometric staining pattern of TLN single cell suspensions, labeled with rat anti–mouse MHCII (PE) and hamster anti–mouse CD11c (PE-Cy5). Two clusters were invariably distinguished in the CD11c+MHCII+ quadrant. (B) The animals were given an intratracheal instillation of a 10 mg/ml FITC-OVA solution (gray histogram) or PBS as a control (white histogram). After 24 h, only group 1 LNDCs acquired a strong FITC signal.
Figure 3
Figure 3
Morphology of sorted group 1 (MHCIIhi CD11cmed-hi) LNDCs 24 h after intratracheal instillation of DX-FITC, as seen under fluorescence microscopy. The cells, sometimes appearing in clusters (B), have numerous MHCII+ (bright red) cytoplasmic processes (A), kidney-shaped nuclei, and granular concentrations of FITC-bright material inside the cytoplasm.
Figure 3
Figure 3
Morphology of sorted group 1 (MHCIIhi CD11cmed-hi) LNDCs 24 h after intratracheal instillation of DX-FITC, as seen under fluorescence microscopy. The cells, sometimes appearing in clusters (B), have numerous MHCII+ (bright red) cytoplasmic processes (A), kidney-shaped nuclei, and granular concentrations of FITC-bright material inside the cytoplasm.
Figure 4
Figure 4
In vitro uptake of FITC-OVA by group 1 (A) and group 2 (B) LNDCs. Filled and open symbols represent uptake at 37°C and 4°C, respectively. Values are mean fractions of FITC+ cells ±SE derived from triplicate experiments. Both LNDC subgroups are equally capable of taking up FITC-OVA in vitro.
Figure 5
Figure 5
Comparison of different fluorescein-conjugated macromolecules in their ability to be transported within AW-LNDCs. Bar heights represent mean percentage of FITC+ AW-LNDCs ±SE. Notice low uptake of mannosylated FITC-BSA compared with FITC-DX on FITC-OVA.
Figure 6
Figure 6
Kinetics of DC entry into TLNs. Groups of mice were killed at several time intervals after intratracheal instillation of a 1% FITC-OVA solution. The fraction of FITC+ cells was determined within AW- (•) and NAW- (○) LNDCs (formerly group 1 and group 2 LNDCs, respectively). Each time point is derived from four to seven mice and represents the mean percentage of fluorescein-positive LNDCs ±SE, subtracting background autofluorescence obtained from PBS-instilled mice (dotted line).
Figure 7
Figure 7
Treatment of TK-TG bone marrow chimeras with systemic (sys) GCV: impact on FITC-OVA transport within AW-LNDCs. Bars represent mean fraction of FITC+ AW-LNDCs ±SE. The depletion in absolute number of AW-LNDCs was taken into account when calculating the percentage of FITC+ cells in the GCV-treated group.
Figure 8
Figure 8
(A) Identification of DCs in collagenase digests of whole lungs (parenchymal tissue and large airways including trachea, no bronchoalveolar lavage) after collagenase/DNase/EDTA treatment. Pulmonary DCs, defined as CD11c+/low autofluorescence cells, were found to be MHCII+, in contrast to CD11c+/high autofluorescence cells. (B) CD11c+ TLN cells obtained using the same organ digestion protocol show even higher MHCII expression.
Figure 9
Figure 9
Phenotypic comparison between DCs identified in whole lung digests (pulm-DC defined as CD11c+/low autofluorescence; see Fig. 8 A) and DC subsets within TLNs (see Fig. 2 A). Cells were phenotyped right after organ digest, without any additional enrichment procedure. Semitransparent histograms, isotype controls; gray histograms, Ag-specific antibodies. (A) Lineage markers. (B) T cell costimulatory molecules/maturation markers. Compared with pulm-DCs, AW-LNDCs have upregulated levels of CD40, B7-2, and ICAM-1 (framed markers) and upregulate low levels of CD8α as well (arrow, A). Note the strong expression of CD8α on NAW-LNDCs.
Figure 9
Figure 9
Phenotypic comparison between DCs identified in whole lung digests (pulm-DC defined as CD11c+/low autofluorescence; see Fig. 8 A) and DC subsets within TLNs (see Fig. 2 A). Cells were phenotyped right after organ digest, without any additional enrichment procedure. Semitransparent histograms, isotype controls; gray histograms, Ag-specific antibodies. (A) Lineage markers. (B) T cell costimulatory molecules/maturation markers. Compared with pulm-DCs, AW-LNDCs have upregulated levels of CD40, B7-2, and ICAM-1 (framed markers) and upregulate low levels of CD8α as well (arrow, A). Note the strong expression of CD8α on NAW-LNDCs.
Figure 10
Figure 10
OVA-TCR transgenic T cell proliferation induced by different subsets of TLN DCs. Values represent tritiated thymidine uptake by T cells, expressed as mean counts per minute ±SE derived from triplicate assays. ▾, AW-LNDCs from FITC-OVA–instilled mice; •, NAW-LNDCs from the same mice; ⋄, AW-LNDCs from FITC-DX–instilled mice.

References

    1. Banchereau J., Steinman R.M. Dendritic cells and the control of immunity. Nature. 1998;392:245–252. - PubMed
    1. Holt P.G., Schon-Hegrad M.A., Oliver J. MHC class II antigen–bearing dendritic cells in pulmonary tissues of the rat. Regulation of antigen presentation activity by endogenous macrophage populations. J. Exp. Med. 1988;167:262–274. - PMC - PubMed
    1. Brokaw J.J., White G.W., Baluk P., Anderson G.P., Umemoto E.Y., McDonald D.M. Glucocorticoid-induced apoptosis of dendritic cells in the rat tracheal mucosa. Am. J. Respir. Cell Mol. Biol. 1998;19:598–605. - PubMed
    1. Schon-Hegrad M.A., Oliver J., McMenamin P.G., Holt P.G. Studies on the density, distribution, and surface phenotype of intraepithelial class II major histocompatibility complex antigen (Ia)–bearing dendritic cells (DC) in the conducting airways. J. Exp. Med. 1991;173:1345–1356. - PMC - PubMed
    1. Gallucci S., Lolkema M., Matzinger P. Natural adjuvantsendogenous activators of dendritic cells. Nat. Med. 1999;5:1249–1255. - PubMed

Publication types