. 2001 Jan 15;193(2):207-18.
doi: 10.1084/jem.193.2.207.

Mice lacking expression of the chemokines CCL21-ser and CCL19 (plt mice) demonstrate delayed but enhanced T cell immune responses

Affiliations

Mice lacking expression of the chemokines CCL21-ser and CCL19 (plt mice) demonstrate delayed but enhanced T cell immune responses

S Mori et al. J Exp Med. .

Abstract

The paucity of lymph node T cells (plt) mutation leads to a loss of CCL21 and CCL19 expression in secondary lymphoid organs. plt mice have defects in the migration of naive T cells and activated dendritic cells into the T cell zones of lymphoid organs, suggesting that they would have defects in T cell immune responses. We now demonstrate T cell responses in plt mice are delayed but ultimately enhanced. Responses to contact sensitization are decreased at day 2 after priming but increased at day 6. After subcutaneous immunization, antigen-specific T cell proliferation and cytokine production in plt mice are increased and remain markedly elevated for at least 8 wk. Compared with wild-type mice, a proportion of T cell response in plt mice are shifted to the spleen, and prior splenectomy reduces the T cell response in draining lymph nodes. After immunization of plt mice, T cells and dendritic cells colocalize in the superficial cortex of lymph nodes and in splenic bridging channels, but not in T cell zones. These results demonstrate that plt mice mount robust T cell responses despite the failure of naive T cells and activated dendritic cells to enter the thymus dependent areas of secondary lymphoid organs.


Figures

Figure 1
Figure 1
Contact hypersensitivity response and kinetics of leukocyte accumulation in LNs and spleen after immunization. (A) Mice were sensitized with 150 μl 7% PCl in acetone/olive oil or vehicle alone, and 2 or 6 d later, 20 μl of 1% PCl was applied to the right ear with vehicle alone applied to the left ear. Ear thickness was measured at the indicated times after elicitation. Ear swelling was calculated in comparison to baseline. Mean ± SD for four to five mice are indicated. (B and C) Cells from draining LNs (B) or spleen (C) were harvested from WT (○) or plt (•) mice at day 0, 4, 9, and 20 after immunization. Cells were counted, stained with anti–TCR-Cβ, anti-CD4, anti-CD8, anti-B220, anti–I-A, or anti-CD11c mAb, and analyzed by flow cytometry. Cell numbers were calculated from the total cell number and the percentage of positive cells, and indicated as the number per single LN or spleen. Mean ± SD for two mice are indicated. Similar results were obtained in a repeat experiment.
Figure 2
Figure 2
Localization of T cells, B cells, and DCs in the draining LNs and spleen of OVA-immunized mice. Draining popliteal LNs from WT (A, C, and E) and plt mice (B, D, and F), and spleens from WT (G, I, K, and M) and plt mice (H, J, L, and N) were harvested at 9 d after immunization. Frozen sections were stained with mAbs anti-Thy1.2 for T cells (green in A, B, E, F, G, H, K, and L, or brown in M and N), anti-B220 for B cells (red in A, B, G, and H, green in C, D, I, and J, or blue in M and N), and anti–DEC-205 for DCs (red in E, F, K, and L). T and B cells (A, B, G, H, M, and N), B cells and DCs (C, D, I, and J), and T cells and DCs (E, F, K, and L) are shown. t, T cell zones; b, B cell follicles. Arrows indicate the subcapsular sinus. Arrowheads indicate splenic bridging channels. Colocalization signal is indicated as yellow/orange. Bars, 100 μm (A–L). Original magnification: (M and N) ×20.
Figure 3
Figure 3
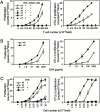
Draining LN T cell responses after OVA immunization. Mice were immunized subcutaneously with 100 μg OVA in CFA. 9 d later, T cells purified from pooled draining LNs or pooled draining LN cells were examined for proliferation and IL-2 production. (A) Sequentially diluted purified draining LN T cells cultured in the presence or absence of 1,600 μg/ml OVA and 5 × 10⁵ of irradiated BALB/c spleen cells. (B) 2 × 10⁵ purified T cells cultured with indicated dose of OVA and 5 × 10⁵ of irradiated spleen cells. (C) Sequentially diluted draining LN cells (unpurified) were cultured with or without 1,600 μg/ml of OVA. Proliferation and IL-2 production were assessed as described in Materials and Methods. Values represent means ± SD from triplicate samples. One of two similar experiments is shown.
Figure 4
Figure 4
Time course of draining LN and splenic T cell responses after OVA immunization. Draining LN cells (A) or spleen cells (B) were harvested 2, 4, 9, 20, and 56 d after immunization and cultured at 5 × 10⁵ cells/well with various doses of OVA. Proliferation and IL-2 production were assessed as described in Materials and Methods. Means ± SD from triplicate tests are indicated. Representative results from three independent experiments is shown.
Figure 5
Figure 5
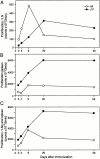
Time course of total draining LN, total splenic, and total lymphoid organ T cell proliferative responses after OVA immunization. Results calculated on the basis of data from Fig. 4. Total proliferative response per draining LN (A) or per spleen (B) was calculated by multiplying the proliferation per cell at 1.6 μg/ml of OVA (derived from Fig. 4) by the mean LN or spleen cell number at the indicated times after immunization. (C) The total lymphoid organ T cell proliferative response was calculated by summing the responses of four draining LNs (two popliteal and two inguinal LNs) and spleen.
Figure 6
Figure 6
Effect of prior splenectomy on draining LN T cell responses. Spleens were removed from WT (○) and plt mice (•) at least 9 d before immunization. Splenectomized and normal mice were immunized subcutaneously with 100 μg OVA in CFA. Draining LN cells were harvested from mice at day 9 (A–D) or day 20 (E–H) after immunization and their proliferation and IL-2 production were measured as in the legend to Fig. 4. Means ± SD from triplicate tests are indicated.
Figure 7
Figure 7
T cell migration into LNs through HEV vs. afferent lymphatics. T cells from nonimmunized mice (naive T), draining LN T cells from OVA-immunized mice (dLN T), or activated (CD45RB) splenic T cells from OVA-immunized mice (CD45RB T) were enriched, labeled with BCECF or CMFDA, and injected into WT (cross-hatched bars) or plt (black bars) recipients. All panels show the percentage of injected cells recovered from the draining or nondraining LNs of recipients. (A) 107 naive T cells injected by tail vein (i.v.) into immunized (imm) mice. (B) 1.4 × 10⁷ draining LN T cells injected by tail vein into immunized mice. (C) 107 CD45RB splenic T cells injected by tail vein into immunized mice. (D) 107 naive T cells injected into the foot pads (s.c.) of nonimmunized mice. (E) 107 naive T cells injected into the foot pads of immunized mice. (F) 107 draining LN T cells injected into the foot pads of immunized mice. All immunized mice were used at day 9 after immunization. 6 h after injection of labeled T cells, draining and nondraining LNs were collected and BCECF- or CMFDA-positive cells analyzed by flow cytometry. Percentage of input cells recovered per LN was calculated from total cell count and percentage of the fluorescence-positive cells, and mean ± SD from three mice are indicated. *P < 0.05, **P < 0.01, ***P < 0.001 for plt vs. WT. Pop/Ing, popliteal/inguinal; Cer/Axi/Bra, cervical/axillary/brachial.

References

    1. Banchereau J., Steinman R.M. Dendritic cells and the control of immunity. Nature. 1998;392:245–252. - PubMed
    1. Lanzavecchia A., Sallusto F. Dynamics of T lymphocyte responsesintermediates, effectors, and memory cells. Science. 2000;290:92–97. - PubMed
    1. Cyster J.G. Chemokines and cell migration in secondary lymphoid organs. Science. 1999;286:2098–2102. - PubMed
    1. Cyster J.G. Leukocyte migrationscent of the T zone. Curr. Biol. 2000;10:R30–R33. - PubMed
    1. Melchers F., Rolink A.G., Schaniel C. The role of chemokines in regulating cell migration during humoral immune responses. Cell. 1999;99:351–354. - PubMed

Publication types