

Multiple cellulose synthase catalytic subunits are required for cellulose synthesis in Arabidopsis
- PMID: 11148295
- PMCID: PMC102235
- DOI: 10.1105/tpc.12.12.2529
Multiple cellulose synthase catalytic subunits are required for cellulose synthesis in Arabidopsis
Abstract
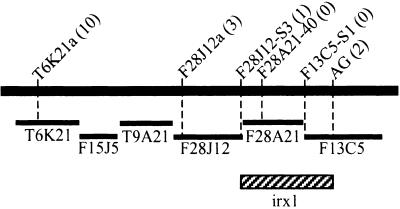
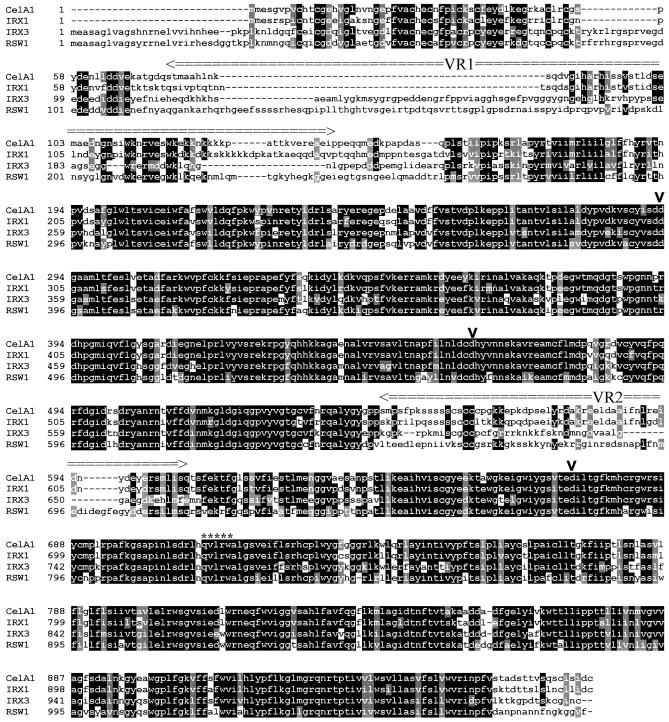
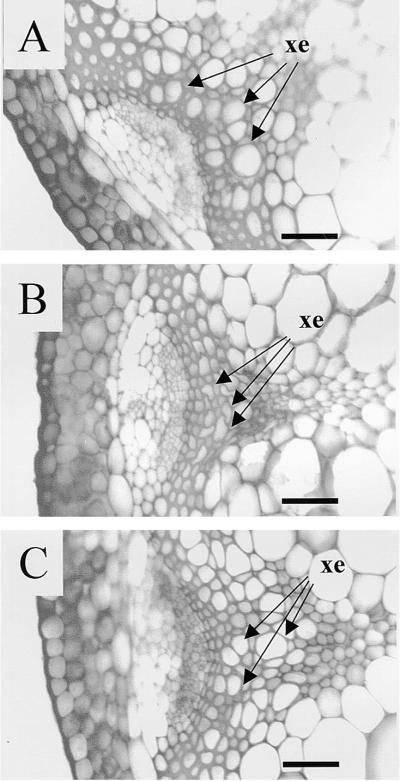
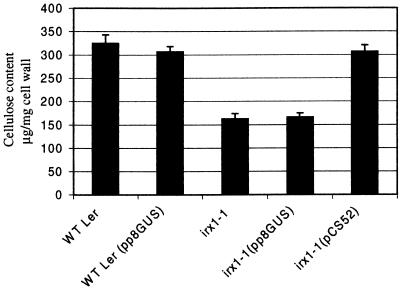
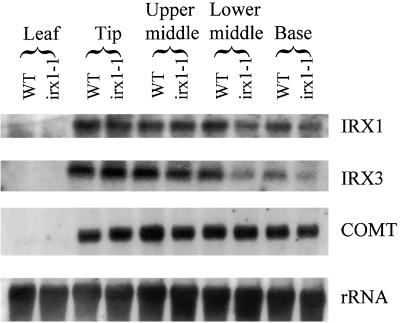
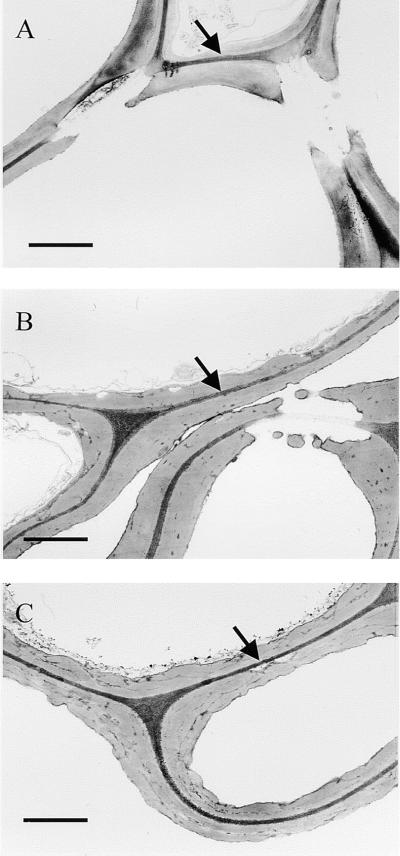
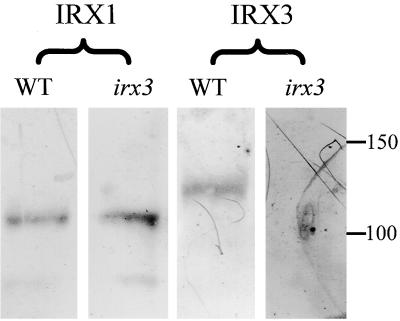
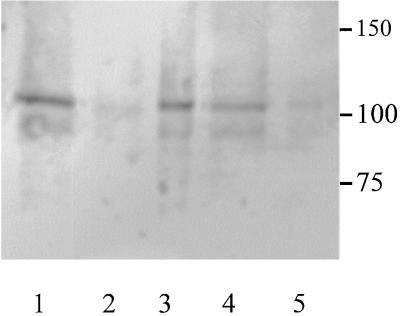
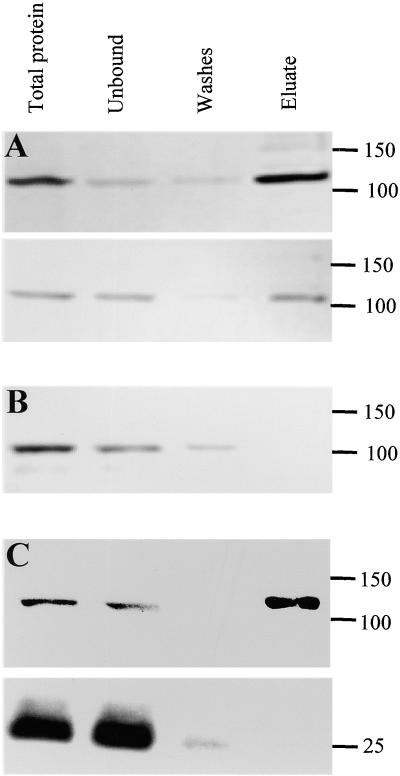
The irregular xylem 1 (irx1) mutant of Arabidopsis has a severe deficiency in the deposition of cellulose in secondary cell walls, which results in collapsed xylem cells. This mutation has been mapped to a 140-kb region of chromosome 4. A cellulose synthase catalytic subunit was found to be located in this region, and genomic clones containing this gene complemented the irx1 mutation. IRX1 shows homology to a previously described cellulose synthase (IRX3). Analysis of the irx1 and irx3 mutant phenotypes demonstrates that both IRX1 and IRX3 are essential for the production of cellulose in the same cell. Thus, IRX1 and IRX3 define distinct classes of catalytic subunits that are both essential for cellulose synthesis in plants. This finding is supported by coprecipitation of IRX1 with IRX3, suggesting that IRX1 and IRX3 are part of the same complex.
Figures
Similar articles
-
Interactions among three distinct CesA proteins essential for cellulose synthesis.Proc Natl Acad Sci U S A. 2003 Feb 4;100(3):1450-5. doi: 10.1073/pnas.0337628100. Epub 2003 Jan 21. Proc Natl Acad Sci U S A. 2003. PMID: 12538856 Free PMC article.
-
The irregular xylem3 locus of Arabidopsis encodes a cellulose synthase required for secondary cell wall synthesis.Plant Cell. 1999 May;11(5):769-80. doi: 10.1105/tpc.11.5.769. Plant Cell. 1999. PMID: 10330464 Free PMC article.
-
The thanatos mutation in Arabidopsis thaliana cellulose synthase 3 (AtCesA3) has a dominant-negative effect on cellulose synthesis and plant growth.New Phytol. 2009;184(1):114-126. doi: 10.1111/j.1469-8137.2009.02960.x. Epub 2009 Jul 23. New Phytol. 2009. PMID: 19645738
-
Cellulose: how many cellulose synthases to make a plant?Curr Biol. 2001 Mar 20;11(6):R213-6. doi: 10.1016/s0960-9822(01)00108-7. Curr Biol. 2001. PMID: 11301265 Review.
-
Cellulose biosynthesis in plants: from genes to rosettes.Plant Cell Physiol. 2002 Dec;43(12):1407-20. doi: 10.1093/pcp/pcf164. Plant Cell Physiol. 2002. PMID: 12514238 Review.
Cited by
-
Identification and Analysis of the Mechanism of Stem Mechanical Strength Enhancement for Maize Inbred Lines QY1.Int J Mol Sci. 2024 Jul 27;25(15):8195. doi: 10.3390/ijms25158195. Int J Mol Sci. 2024. PMID: 39125770 Free PMC article.
-
The translation elongation factor eEF-1Bβ1 is involved in cell wall biosynthesis and plant development in Arabidopsis thaliana.PLoS One. 2012;7(1):e30425. doi: 10.1371/journal.pone.0030425. Epub 2012 Jan 17. PLoS One. 2012. PMID: 22272350 Free PMC article.
-
Comparative transcriptomics analysis of developing peanut (Arachis hypogaea L.) pods reveals candidate genes affecting peanut seed size.Front Plant Sci. 2022 Sep 12;13:958808. doi: 10.3389/fpls.2022.958808. eCollection 2022. Front Plant Sci. 2022. PMID: 36172561 Free PMC article.
-
A Missense Mutation in the Zinc Finger Domain of OsCESA7 Deleteriously Affects Cellulose Biosynthesis and Plant Growth in Rice.PLoS One. 2016 Apr 19;11(4):e0153993. doi: 10.1371/journal.pone.0153993. eCollection 2016. PLoS One. 2016. PMID: 27092937 Free PMC article.
-
Functional analysis of the cellulose synthase genes CesA1, CesA2, and CesA3 in Arabidopsis.Plant Physiol. 2002 Jun;129(2):797-807. doi: 10.1104/pp.010931. Plant Physiol. 2002. PMID: 12068120 Free PMC article.
References
-
- Arioli, T., et al. (1998. a). Molecular analysis of cellulose biosynthesis in Arabidopsis. Science 279 717–720. - PubMed
-
- Arioli, T., Burn, J.E., Betzner, A.S., and Williamson, R.E. (1998. b). Response: How many cellulose synthase–like gene products actually make cellulose? Trends Plant Sci. 3 165–166.
-
- Bent, A.F., and Clough, S.J. (1998). Agrobacterium germ-line transformation: Transformation of Arabidopsis without tissue culture. In: Plant Molecular Biology Manual, 2nd ed, S.B. Gelvin and R.A. Schilperoot, eds (Dordrecht, The Netherlands: Kluwer Academic Publishers), Section B7, pp. 1–14.
-
- Brown, R.M. (1996). The biosynthesis of cellulose. J. Macromol. Sci. Pure Appl. Chem. A33 1345–1373.
-
- Brown, R.M., Saxena, I.M., and Kudlicka, K. (1996). Cellulose biosynthesis in higher plants. Trends Plant Sci. 1 149–156.
MeSH terms
Substances
LinkOut - more resources
Full Text Sources
Other Literature Sources
Molecular Biology Databases
