. 2001 Feb;75(3):1236-51.
doi: 10.1128/JVI.75.3.1236-1251.2001.

Characterization of herpes simplex virus-containing organelles by subcellular fractionation: role for organelle acidification in assembly of infectious particles

Affiliations

Characterization of herpes simplex virus-containing organelles by subcellular fractionation: role for organelle acidification in assembly of infectious particles

C A Harley et al. J Virol. 2001 Feb.

Abstract

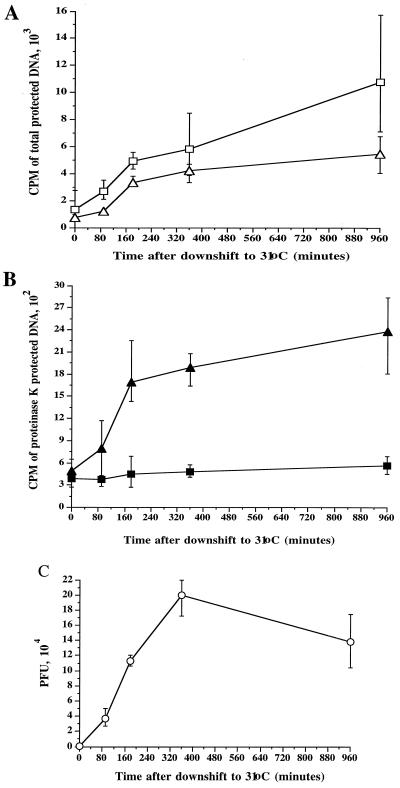
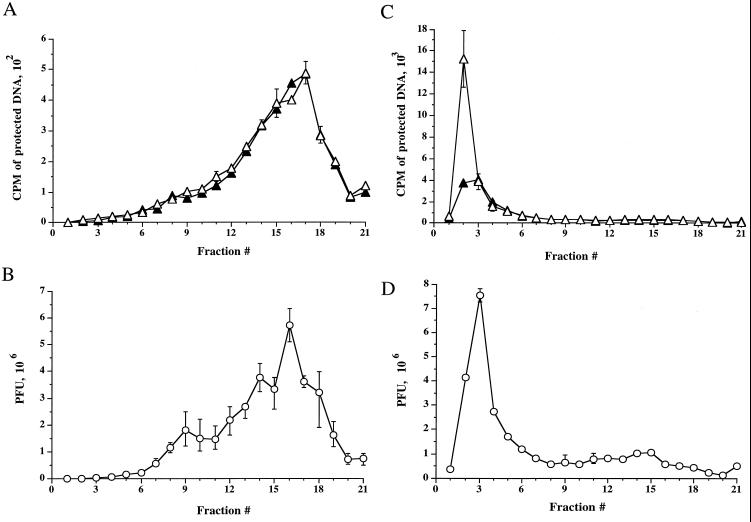
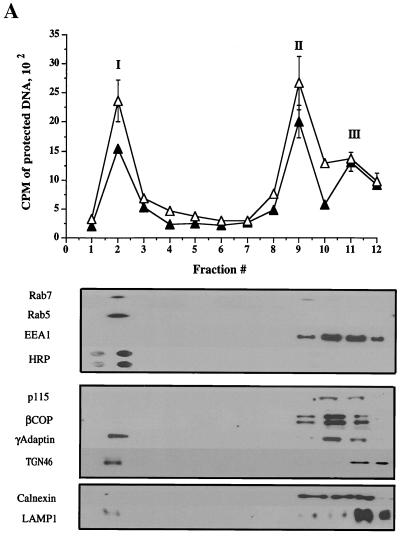
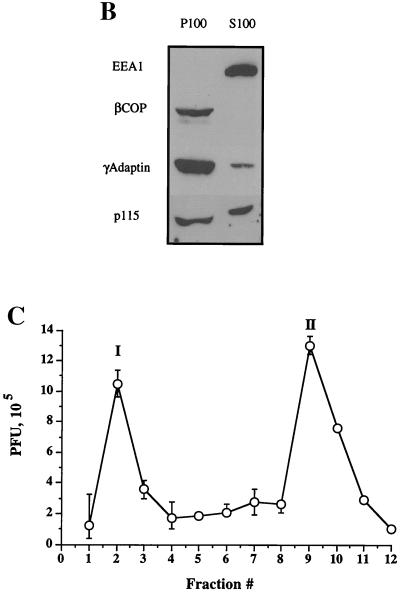
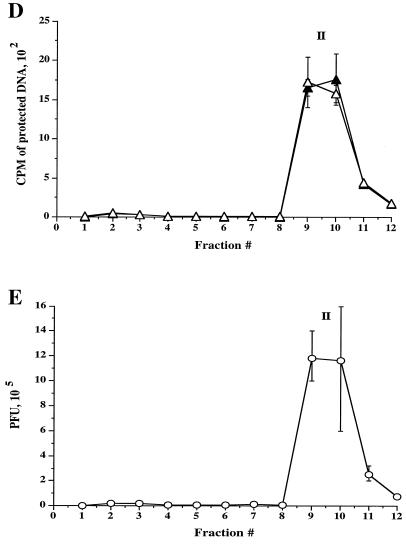
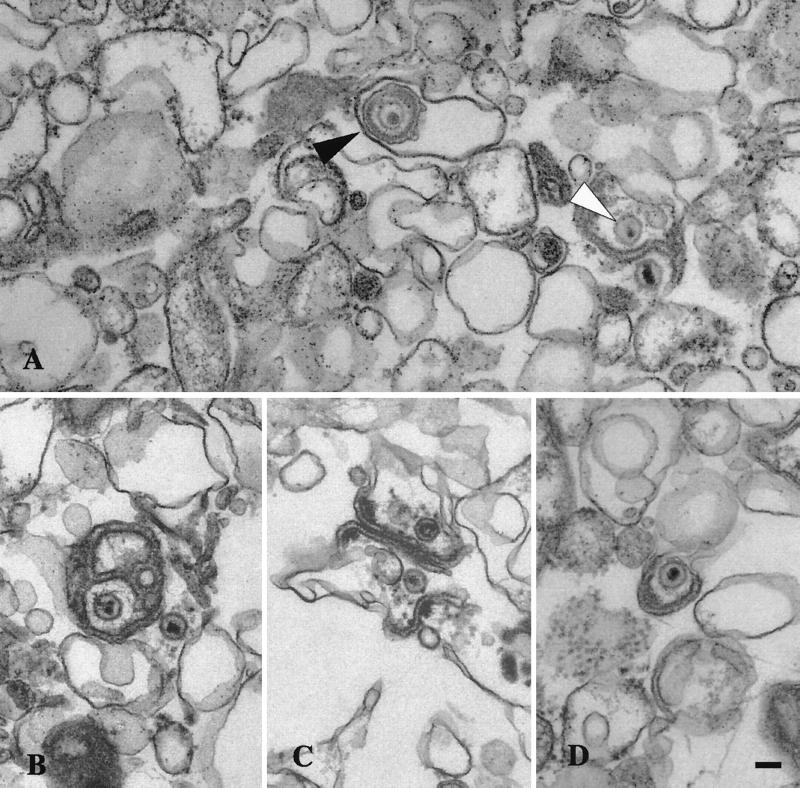
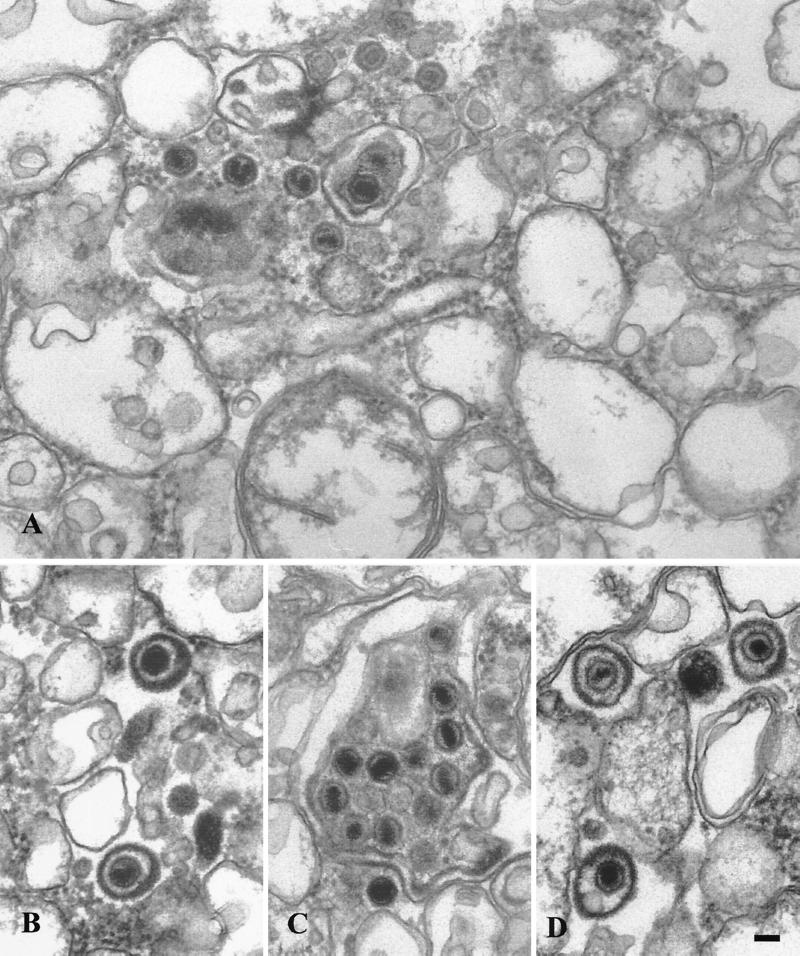
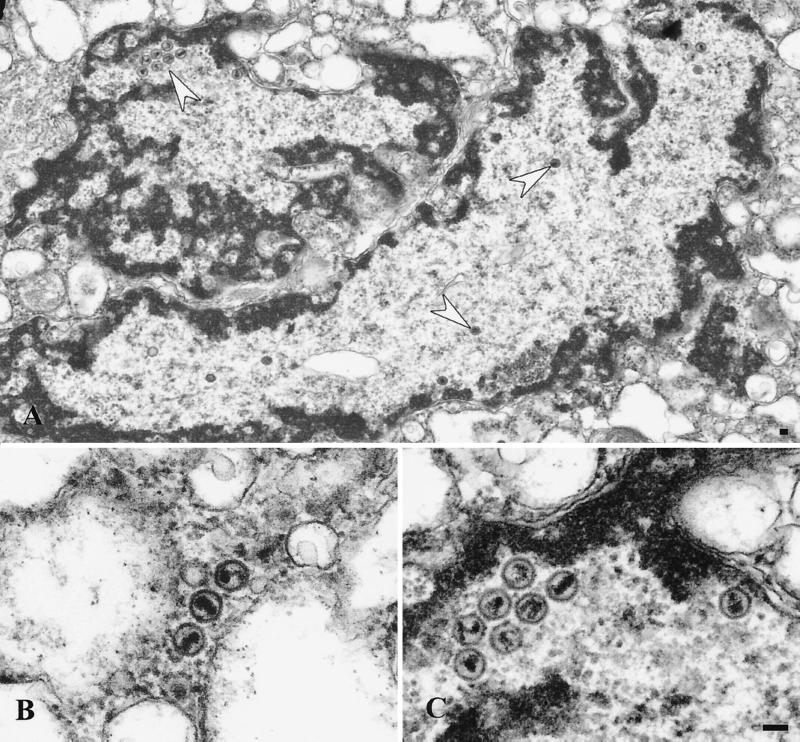
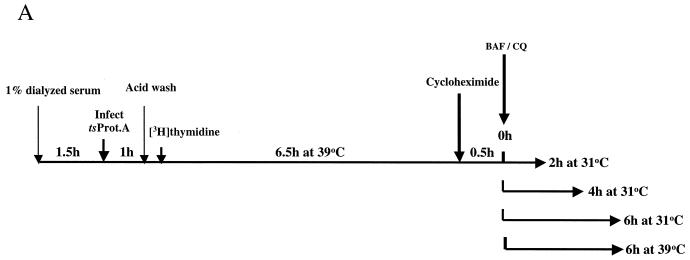
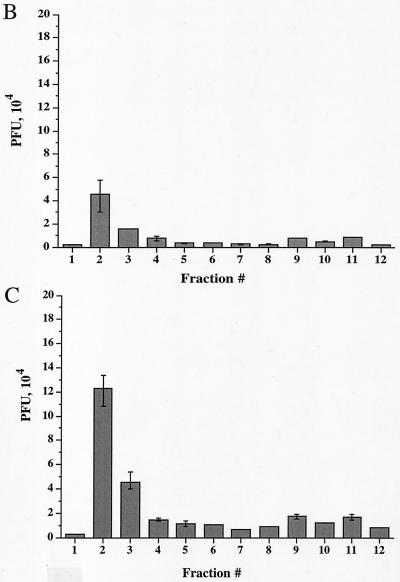
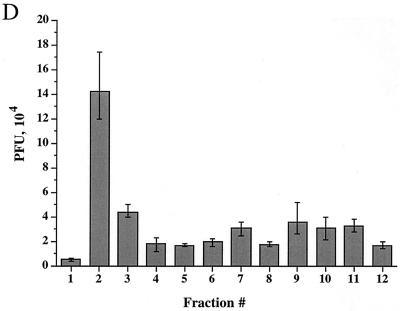
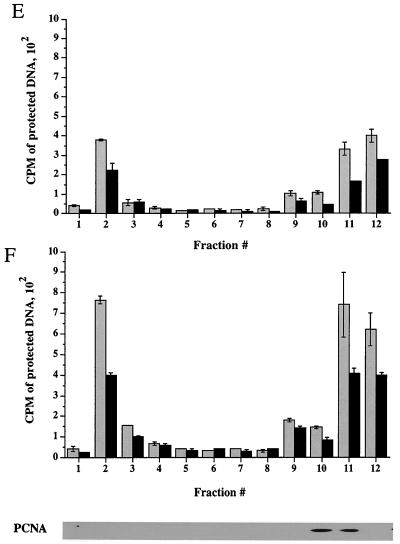
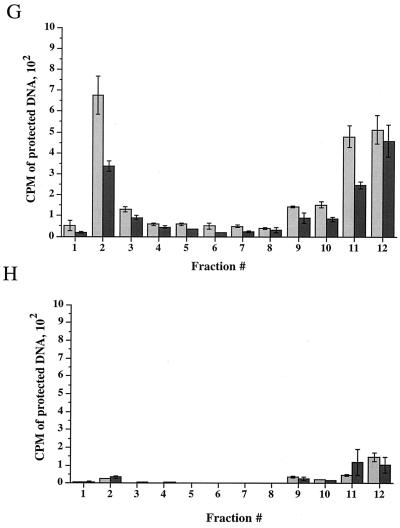
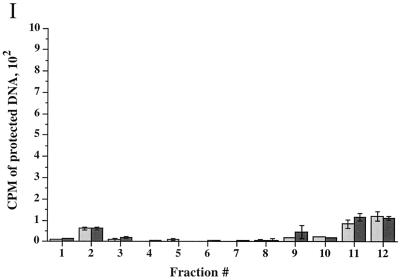
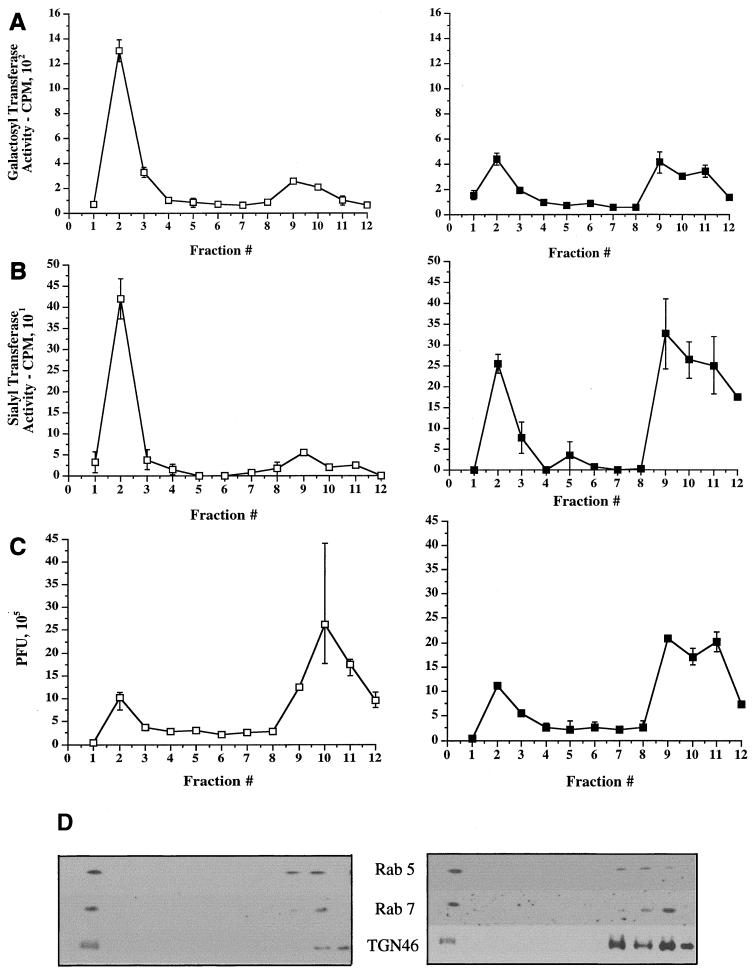
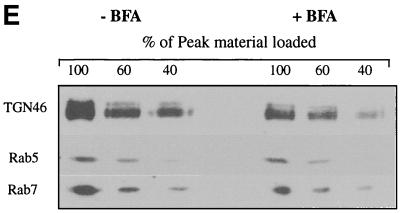
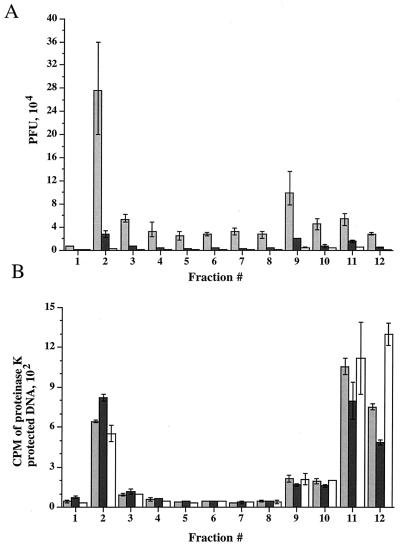
The cytoplasmic compartments occupied by exocytosing herpes simplex virus (HSV) are poorly defined. It is unclear which organelles contain the majority of trafficking virions and which are occupied by virions on a productive rather than defective assembly pathway. These problems are compounded by the fact that HSV-infected cells produce virus continuously over many hours. All stages in viral assembly and export therefore coexist, making it impossible to determine the sequence of events and their kinetics. To address these problems, we have established assays to monitor the presence of capsids and enveloped virions in cell extracts and prepared HSV-containing organelles from normally infected cells and from cells undergoing a single synchronized wave of viral egress. We find that, in both cases, HSV particles exit the nucleus and accumulate in organelles which cofractionate with the trans-Golgi network (TGN) and endosomes. In addition to carrying enveloped infectious virions in their lumen, HSV-bearing organelles also displayed nonenveloped capsids attached to their cytoplasmic surface. Neutralization of organellar pH by chloroquine or bafilomycin A resulted in the accumulation of noninfectious enveloped particles. We conclude that the organelles of the TGN/endocytic network play a key role in the assembly and trafficking of infectious HSV.


Figures

FIG. 1
FIG. 1
Measuring DNA packaging and capsid envelopment using a TCA precipitation assay. HuH7 cells were infected with the HSV strain tsProt.A, acid washed, and then incubated at 39°C in the presence of [3H]thymidine. After 6.5 h, cycloheximide was added, and after a further 30 min the cells were downshifted to 31°C. Total cell extracts were prepared at particular times after downshift (indicated on the horizontal axes) and measured as follows. (A) DNase I-resistant (total packaged) DNA in the presence (squares) or absence (triangles) of 0.05% Triton X-100. (B) Proteinase K/DNase I-resistant (enveloped) DNA in the presence (solid squares) or absence (solid triangles) of 0.05% Triton X-100. (C) PFU present in each extract. In each case, plotted values represent the mean of two to four samples, and error bars indicate the range from the mean.
FIG. 2
FIG. 2
Intracellular cytoplasmic virus is less dense than extracellular virus. [3H]thymidine-labeled extracellular virus (A and B) or PNS intracellular virus (C and D) from tsProt.A-infected HuH7 cells were subjected to isopycnic centrifugation on a 1.065-g/ml self-forming Percoll gradient. Gradients were fractionated from the top (corresponding to fraction 1), as indicated on the horizontal axes. (A and C) Fractions were assayed for total packaged DNA (open triangles) or proteinase K-protected, enveloped DNA (solid triangles). (B and D) Fractions were titrated for PFU (open circles). Plotted values represent the means of duplicate samples, and error bars indicate the range from the mean.
FIG. 3
FIG. 3
Fractionation of intracellular virus by sucrose equilibrium density gradient centrifugation. Intracellular (A and C) or extracellular (D and E) virus was prepared as described for Fig. 2 and subjected to sucrose density gradient centrifugation. Fractions were collected from the top of the gradient, as indicated on the horizontal axes (fraction 1 is at the top of the gradient). (A) Top: Intracellular fractions were assayed for packaged and enveloped DNA (open and solid symbols, respectively). The three peaks of radioactivity are labeled I, II, and III. Bottom: Intracellular fractions were subjected to Western blot analysis for the organelle markers rab7 (late endosomes), rab5 and EEA1 (early endosomes), HRP (bulk-phase endocytic compartments), p115 and β-COP (Golgi apparatus), γ-adaptin (TGN, clathrin-coated vesicles), TGN46 (trans-Golgi network), calnexin (microsomes—ER), and LAMP1 (lysosomes). (B) PNSs were subjected to a 100,000 × g spin, and the resulting pellet (P100) and supernatant (S100) were Western blotted for the antigens indicated at the left. (C) Intracellular fractions were titrated for PFU. (D) Extracellular virus gradient fractions were assayed for packaged and enveloped DNA (open and solid symbols, respectively). (E) Extracellular virus gradient fractions were titrated for PFU. All plotted values represent the mean of duplicate samples, and error bars indicate the range from the mean.
FIG. 3
FIG. 3
Fractionation of intracellular virus by sucrose equilibrium density gradient centrifugation. Intracellular (A and C) or extracellular (D and E) virus was prepared as described for Fig. 2 and subjected to sucrose density gradient centrifugation. Fractions were collected from the top of the gradient, as indicated on the horizontal axes (fraction 1 is at the top of the gradient). (A) Top: Intracellular fractions were assayed for packaged and enveloped DNA (open and solid symbols, respectively). The three peaks of radioactivity are labeled I, II, and III. Bottom: Intracellular fractions were subjected to Western blot analysis for the organelle markers rab7 (late endosomes), rab5 and EEA1 (early endosomes), HRP (bulk-phase endocytic compartments), p115 and β-COP (Golgi apparatus), γ-adaptin (TGN, clathrin-coated vesicles), TGN46 (trans-Golgi network), calnexin (microsomes—ER), and LAMP1 (lysosomes). (B) PNSs were subjected to a 100,000 × g spin, and the resulting pellet (P100) and supernatant (S100) were Western blotted for the antigens indicated at the left. (C) Intracellular fractions were titrated for PFU. (D) Extracellular virus gradient fractions were assayed for packaged and enveloped DNA (open and solid symbols, respectively). (E) Extracellular virus gradient fractions were titrated for PFU. All plotted values represent the mean of duplicate samples, and error bars indicate the range from the mean.
FIG. 4
FIG. 4
Ultrastructural analysis of peak I. Material from peak I was pelleted and fixed in glutaraldehyde and prepared for transmission electron microscopy as described in the text. (A) Enveloped virus particle enclosed within a smooth membrane compartment (indicated by the black arrow head) and naked capsids in close proximity to an organellar membrane (indicated by the white arrowhead). (B, C, and D) Additional representative images from peak I. Bar, 0.1 μm.
FIG. 5
FIG. 5
Ultrastructural analysis of peak II. Extracts were prepared as described for Fig. 4. (A) Representative section showing mainly naked capsids. (B and D) Presence of singularly enveloped virus particles and (C) a cluster of capsids enclosed within a single membrane, a minor population in this fraction. Bar, 0.1 μm.
FIG. 6
FIG. 6
Ultrastructural analysis of peak III material. Extracts were prepared as for Fig. 4. (A) Nuclear fragment containing clusters of naked capsids or single capsids (indicated by the white arrows). The region in the upper left, indicated by an arrow, is magnified in panel C. (B) Free naked capsids. Bar, 0.1 μm.
FIG. 7
FIG. 7
Time course of delivery of virus to cytoplasmic organelles. (A) Schematic showing the time course and conditions for this experiment. HuH7 cells were infected with tsProt.A and incubated for 7 h at 39°C in the presence of [3H]thymidine (cycloheximide was added 30 min prior to downshift). Cells were downshifted to 31°C for 0, 2, 4, or 6 h or kept at 39°C for a further 6 h. For each time point, a PNS was prepared and subjected to sucrose gradient centrifugation, and fractions were titrated for PFU. BAF/CQ indicates the time of addition of the drugs bafilomycin A1 and chloroquine in the experiments shown in Fig. 9. (B to D) PFU yields 2, 4 and 6 h after downshift, respectively. Fractions were also assayed for total packaged DNA (light bars) and enveloped DNA (dark bars) at 2, 4, 6, and 0 h after downshift to 31°C (panels E to H, respectively) or after an additional 6 h at 39°C (panel I). Plotted values are means of duplicates, and error bars indicate the range from the mean. An immunoblot for a nuclear marker, proliferating cell nuclear antigen (PCNA), was performed on fractions from a representative 4-h-downshifted gradient (F).
FIG. 7
FIG. 7
Time course of delivery of virus to cytoplasmic organelles. (A) Schematic showing the time course and conditions for this experiment. HuH7 cells were infected with tsProt.A and incubated for 7 h at 39°C in the presence of [3H]thymidine (cycloheximide was added 30 min prior to downshift). Cells were downshifted to 31°C for 0, 2, 4, or 6 h or kept at 39°C for a further 6 h. For each time point, a PNS was prepared and subjected to sucrose gradient centrifugation, and fractions were titrated for PFU. BAF/CQ indicates the time of addition of the drugs bafilomycin A1 and chloroquine in the experiments shown in Fig. 9. (B to D) PFU yields 2, 4 and 6 h after downshift, respectively. Fractions were also assayed for total packaged DNA (light bars) and enveloped DNA (dark bars) at 2, 4, 6, and 0 h after downshift to 31°C (panels E to H, respectively) or after an additional 6 h at 39°C (panel I). Plotted values are means of duplicates, and error bars indicate the range from the mean. An immunoblot for a nuclear marker, proliferating cell nuclear antigen (PCNA), was performed on fractions from a representative 4-h-downshifted gradient (F).
FIG. 8
FIG. 8
Use of BFA to separate Golgi cisternae from TGN/endosomes. An experiment similar to that in Fig. 3 was performed, except that cells were incubated with BFA (5 μg/ml) prepared in ethanol (righthand panels, solid symbols) or with an equivalent volume of ethanol alone (lefthand panels, open symbols) for 1 h prior to PNS preparation and fractionation. Fractions were assayed for galactosyltransferase activity (A), sialyltransferase activity (B), or PFU (C) or Western blotted for rab5, rab7, and TGN46 (D). (E) Peak I was collected following fractionation of BFA-treated and mock-treated cells (as indicated) and then Western blotted as in panel D. Lanes contained 100, 60, or 40% (as indicated at the top of the figure) of the peak I material in panel D.
FIG. 8
FIG. 8
Use of BFA to separate Golgi cisternae from TGN/endosomes. An experiment similar to that in Fig. 3 was performed, except that cells were incubated with BFA (5 μg/ml) prepared in ethanol (righthand panels, solid symbols) or with an equivalent volume of ethanol alone (lefthand panels, open symbols) for 1 h prior to PNS preparation and fractionation. Fractions were assayed for galactosyltransferase activity (A), sialyltransferase activity (B), or PFU (C) or Western blotted for rab5, rab7, and TGN46 (D). (E) Peak I was collected following fractionation of BFA-treated and mock-treated cells (as indicated) and then Western blotted as in panel D. Lanes contained 100, 60, or 40% (as indicated at the top of the figure) of the peak I material in panel D.
FIG. 9
FIG. 9
Infectivity of virus particles within cytoplasmic organelles is dependent on an acidic environment. HuH7 cells were infected with the HSV-1 strain tsProt.A, acid washed, and then incubated at 39°C for 7 h. Cycloheximide (20 μg/ml) was added 30 min prior to downshift to 31°C. At the time of downshift, cells received 150 μM chloroquine or 200 nM bafilomycin A1 or no treatment as shown in Fig. 7A. Cells were then incubated at 31°C for 9 h. PNSs were subjected to sucrose gradient centrifugation and fractionated. (A) PFU titrations of gradient fractions from untreated cells (light gray bars) and cells treated with chloroquine (dark gray bars) or bafilomycin A1 (open bars). (B) Assay for enveloped virions present in untreated cells and cells treated with chloroquine or bafilomycin A1 (indicated as in A). All values plotted are means of duplicate samples, and error bars indicate the range from the mean.

Similar articles

Cited by

References

    1. Alconada A, Bauer U, Sodeik B, Hoflack B. Intracellular traffic of herpes simplex virus glycoprotein gE: characterization of the sorting signals required for its trans-Golgi network localization. J Virol. 1999;73:377–387. - PMC - PubMed
    1. Andoh T, Kawamata H, Umatake M, Terasawa K, Takegami T, Ochiai H. Effect of bafilomycin A1 on the growth of Japanese encephalitis virus in Vero cells. J Neurovirol. 1998;4:627–631. - PubMed
    1. Avitabile E, Ward P L, Di Lazzaro C, Torrisi M R, Roizman B, Campadelli-Fiume G. The herpes simplex virus UL20 protein compensates for the differential disruption of exocytosis of virions and viral membrane glycoproteins associated with fragmentation of the Golgi apparatus. J Virol. 1994;68:7397–7405. - PMC - PubMed
    1. Banfield B W, Tufaro F. Herpes simplex virus particles are unable to traverse the secretory pathway in the mouse L-cell mutant gro29. J Virol. 1990;64:5716–5729. - PMC - PubMed
    1. Banfield W J, Kisch A L. The effect of chloroquine on herpesvirus infection in vitro and in vivo. Proc Soc Exp Biol Med. 1973;142:1018–1022. - PubMed

Publication types

LinkOut - more resources