. 2001 Feb;75(3):1459-75.
doi: 10.1128/JVI.75.3.1459-1475.2001.

Reovirus sigmaNS protein is required for nucleation of viral assembly complexes and formation of viral inclusions

Affiliations

Reovirus sigmaNS protein is required for nucleation of viral assembly complexes and formation of viral inclusions

M M Becker et al. J Virol. 2001 Feb.

Abstract

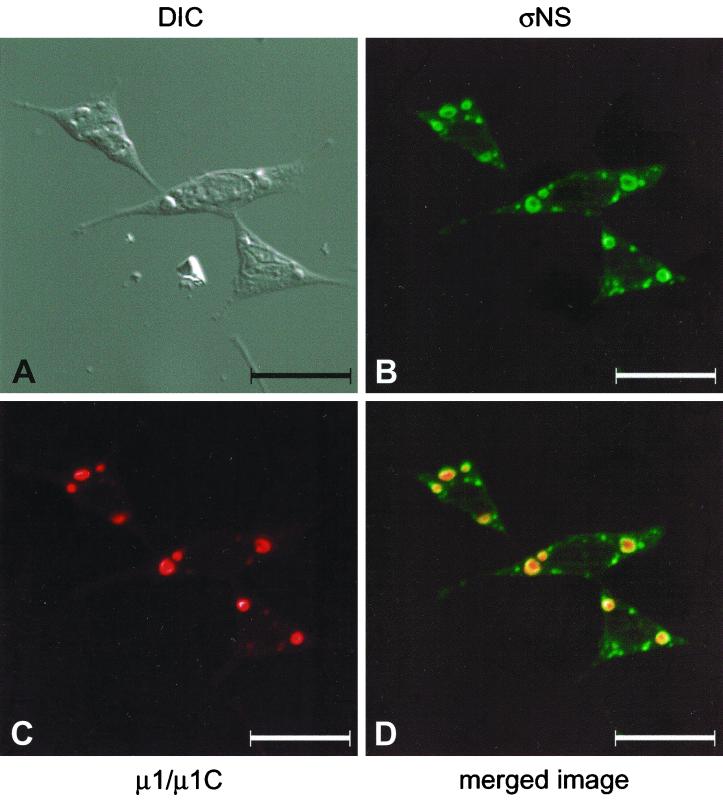
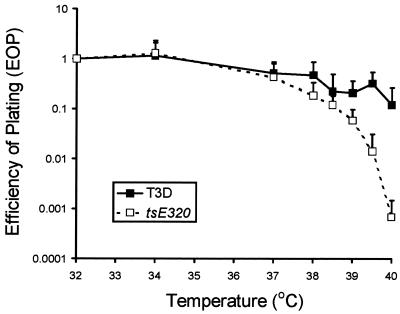
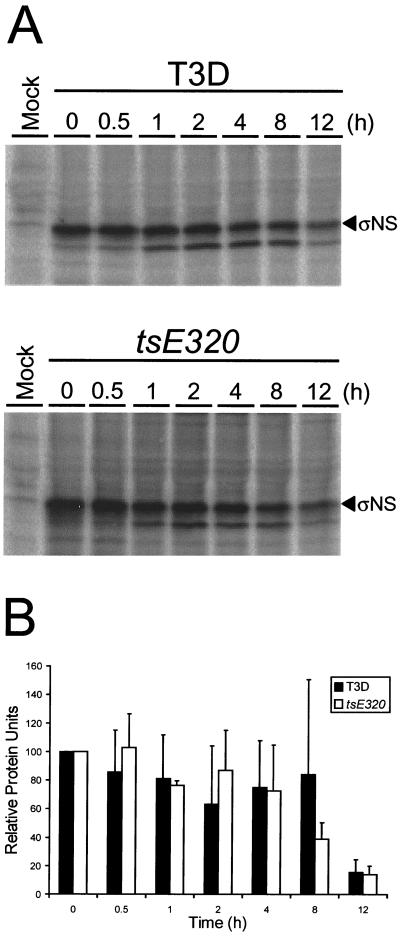
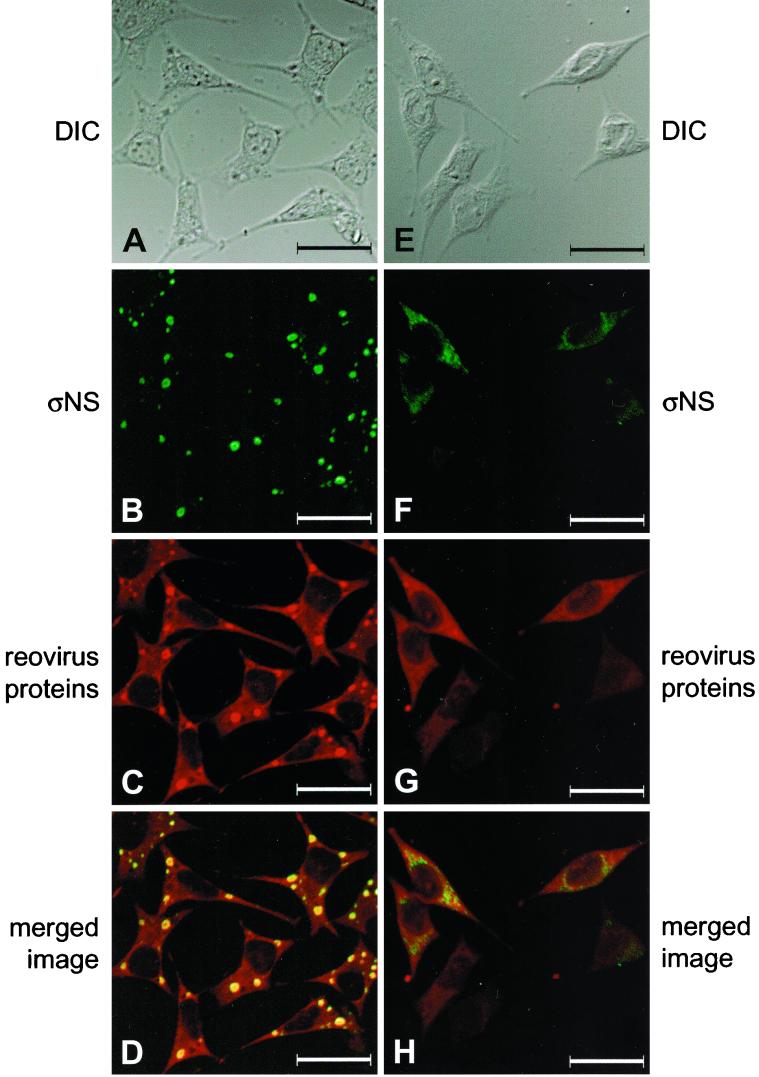
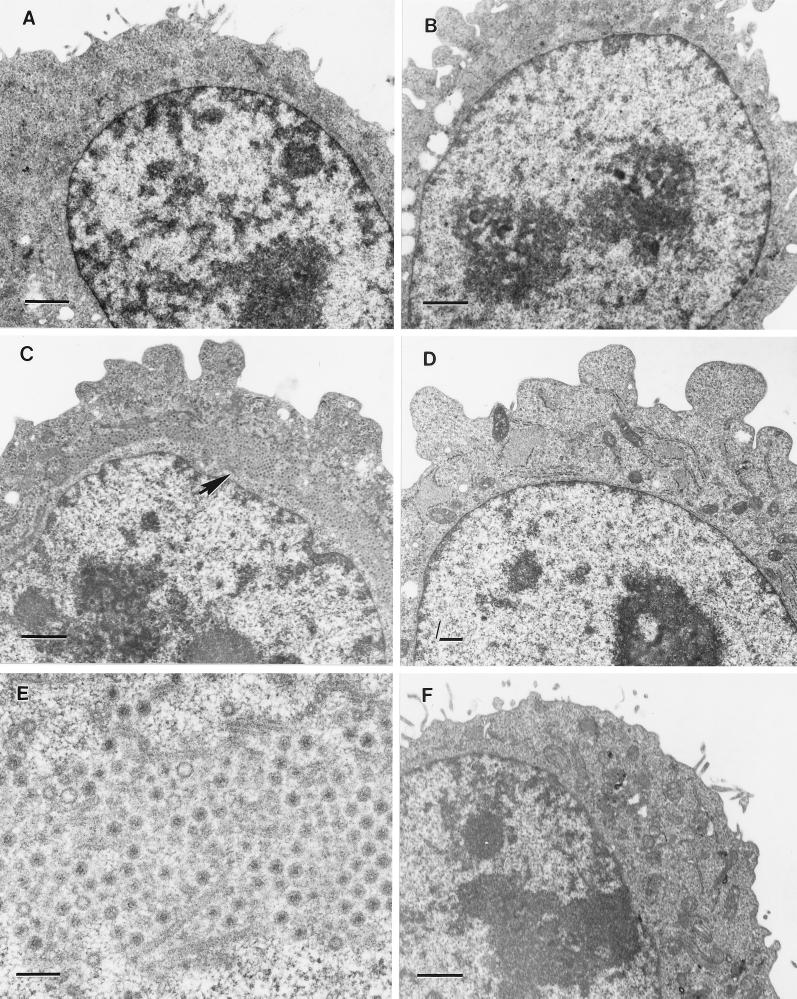
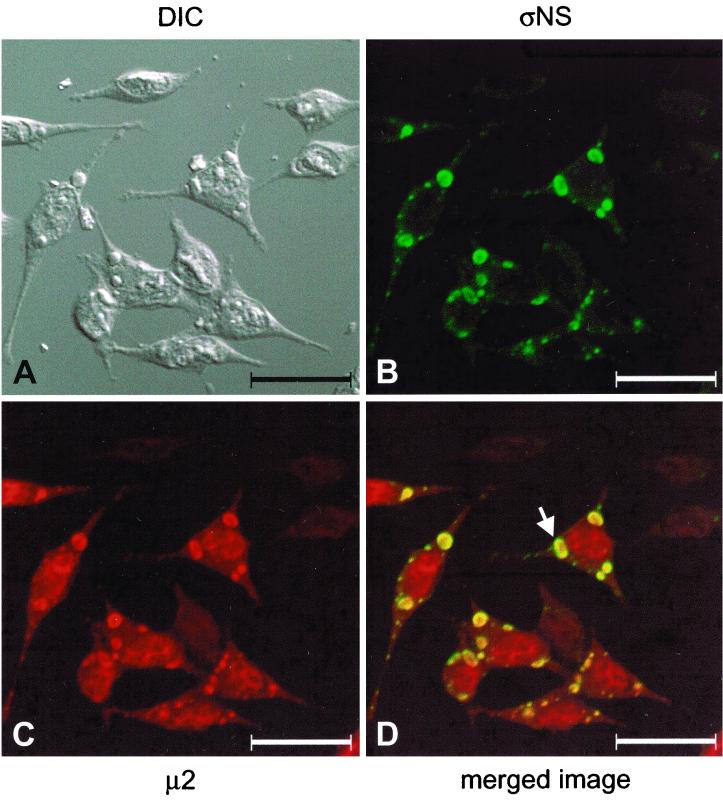
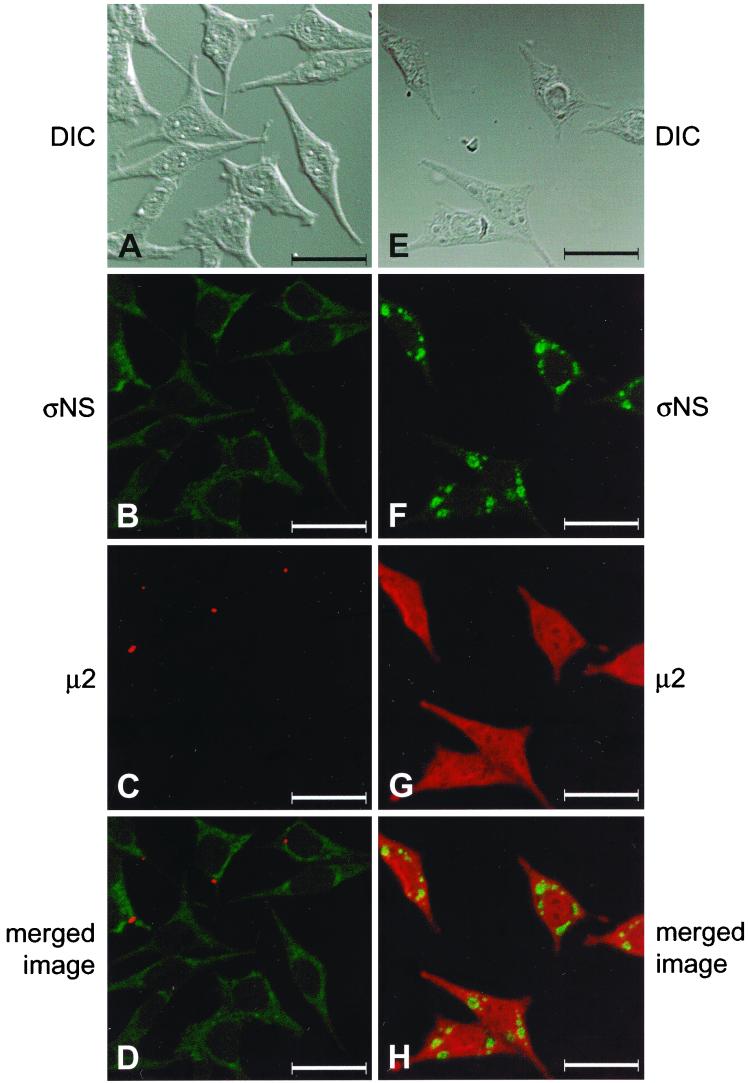
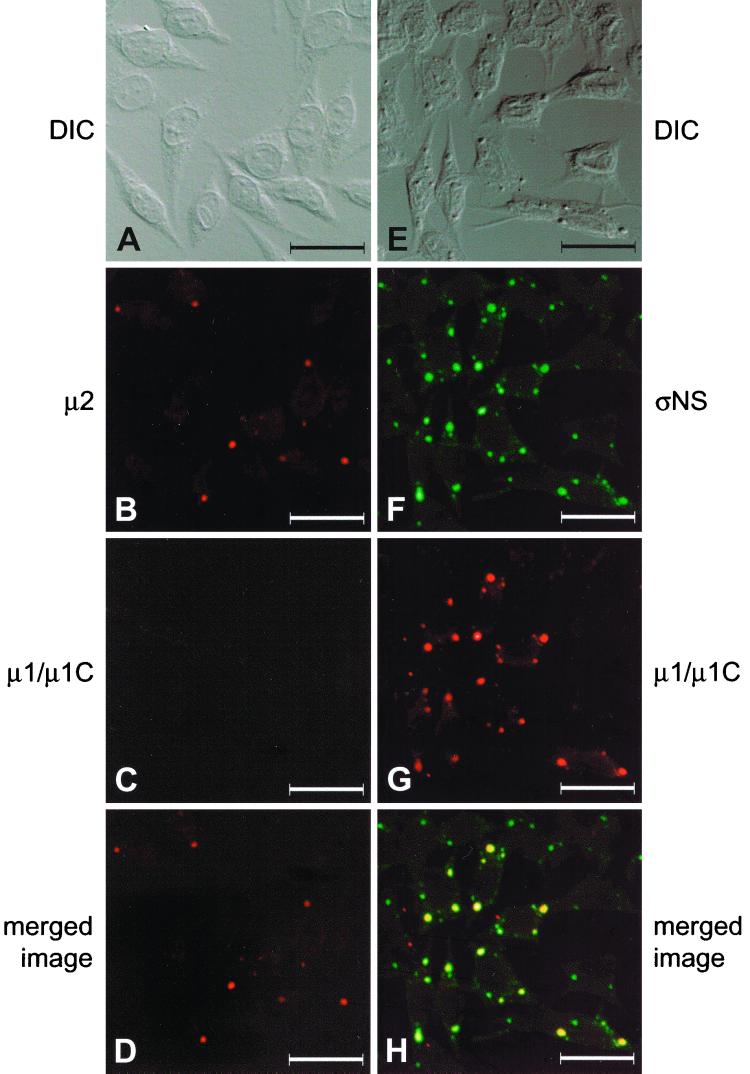
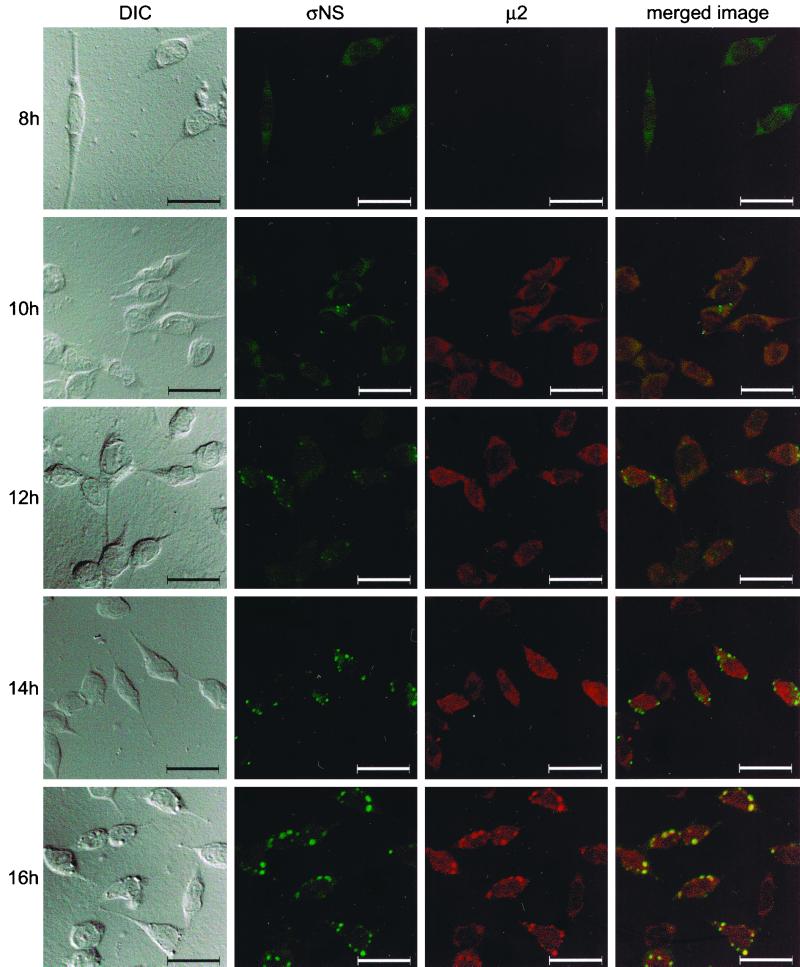
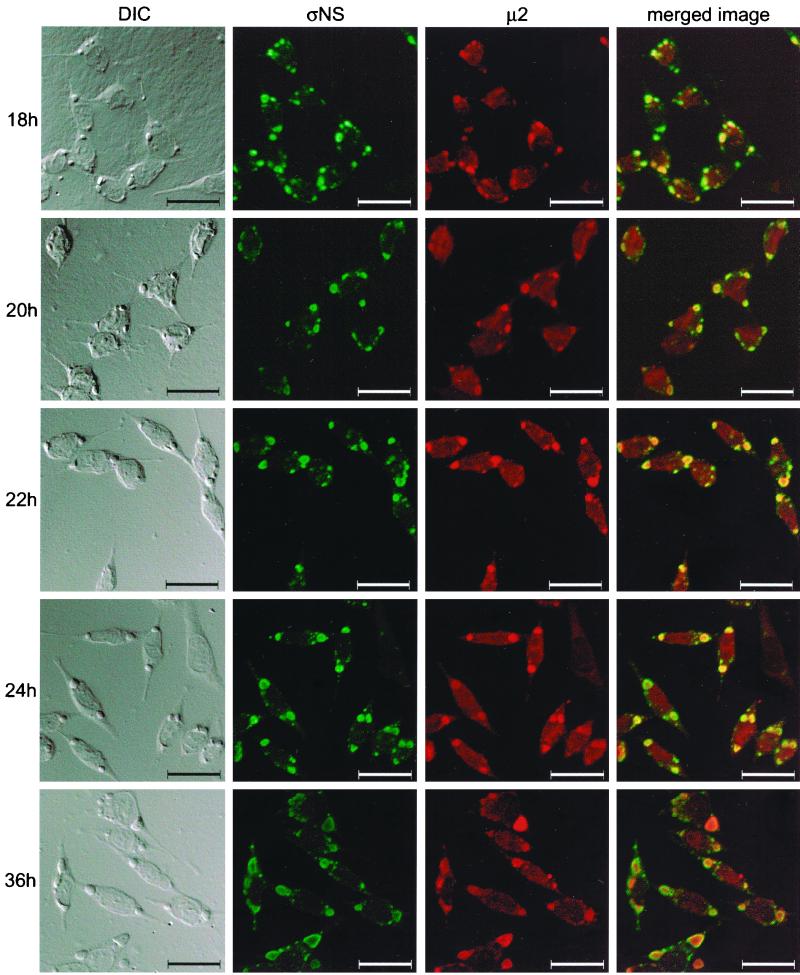
Progeny virions of mammalian reoviruses are assembled in the cytoplasm of infected cells at discrete sites termed viral inclusions. Studies of temperature-sensitive (ts) mutant viruses indicate that nonstructural protein sigmaNS and core protein mu2 are required for synthesis of double-stranded (ds) RNA, a process that occurs at sites of viral assembly. We used confocal immunofluorescence microscopy and ts mutant reoviruses to define the roles of sigmaNS and mu2 in viral inclusion formation. In cells infected with wild-type (wt) reovirus, sigmaNS and mu2 colocalize to large, perinuclear structures that correspond to viral inclusions. In cells infected at a nonpermissive temperature with sigmaNS-mutant virus tsE320, sigmaNS is distributed diffusely in the cytoplasm and mu2 is contained in small, punctate foci that do not resemble viral inclusions. In cells infected at a nonpermissive temperature with mu2-mutant virus tsH11.2, mu2 is distributed diffusely in the cytoplasm and the nucleus. However, sigmaNS localizes to discrete structures in the cytoplasm that contain other viral proteins and are morphologically indistinguishable from viral inclusions seen in cells infected with wt reovirus. Examination of cells infected with wt reovirus over a time course demonstrates that sigmaNS precedes mu2 in localization to viral inclusions. These findings suggest that viral RNA-protein complexes containing sigmaNS nucleate sites of viral replication to which other viral proteins, including mu2, are recruited to commence dsRNA synthesis.


Figures

FIG. 1
FIG. 1
Subcellular localization of reovirus ςNS and μ1/μ1C proteins in cells infected with reovirus strain T3D. L cells were infected with T3D at an MOI of 10 PFU per cell and incubated at 37°C for 18 h. Cells were stained for ςNS by using a ςNS-specific polyclonal antiserum (B) and for μ1/μ1C by using μ1/μ1C-specific MAb 8H6 (C) as primary antibodies followed by Alexa Fluor 488 goat anti-rabbit IgG and Alexa Fluor 546 goat anti-mouse IgG, respectively, as secondary antibodies. Images were obtained by using a confocal microscope. The ςNS protein is colored green, and the μ1/μ1C protein is colored red. (A) A DIC image of the field was obtained. (D) In the merged image, colocalization of ςNS and μ1/μ1C is indicated by the yellow color. Images were processed using Adobe Photoshop. Bars, 25 μm.
FIG. 2
FIG. 2
EOP values for wt T3D and tsE320. EOP values were calculated by dividing the titer determined by plaque assay at each temperature by the titer determined at 32°C. The results are presented as the mean EOPs for at least six independent experiments. Error bars indicate standard deviations of the means.
FIG. 3
FIG. 3
Stability of reovirus ςNS protein in cells infected with T3D or tsE320 at a nonpermissive temperature. L cells were either mock infected or infected with either T3D or tsE320 at an MOI of 10 PFU per cell and incubated at 39.5°C. At 6 h postinfection, cells were pulse-labeled with [35S]methionine-[35S]cysteine for 1 h and then incubated in the absence of radiolabeled methionine-cysteine for the time periods shown. The ςNS protein was immunoprecipitated from cell lysates by using polyclonal ςNS-specific antiserum, resolved by SDS-PAGE, visualized by autoradiography, and quantitated by phosphorimager analysis. (A) Representative autoradiogram. (B) Band densities corresponding to ςNS protein, quantitated with a phosphorimager and normalized to the 0-h time point. The results are presented as the mean relative protein units for three independent experiments. Error bars indicate standard deviations of the means.
FIG. 4
FIG. 4
Subcellular localization of ςNS and reovirus proteins in cells infected with wt T3D or mutant tsE320 at a nonpermissive temperature. L cells were infected with either T3D (A to D) or tsE320 (E to H) at an MOI of 10 PFU per cell and incubated at 37°C (T3D) or 39.5°C (tsE320) for 24 h. Cells were stained for ςNS by using ςNS-specific MAb 2H7 (B and F) and for reovirus proteins by using a polyclonal antiserum raised against T3D (C and G) as primary antibodies followed by Alexa Fluor 488 goat anti-mouse IgG and Alexa Fluor 546 goat anti-rabbit IgG, respectively, as secondary antibodies. Images were obtained by using a confocal microscope. The ςNS protein is colored green, and the reovirus proteins are colored red. (A and E) A DIC image of each field was obtained. (D and H) In the merged images, colocalization of ςNS and reovirus proteins is indicated by the yellow color. Images were processed using Adobe Photoshop. Bars, 25 μm.
FIG. 5
FIG. 5
Ultrastructural analysis of cells infected with tsE320 at permissive and nonpermissive temperatures. L cells were infected with tsE320 at an MOI of 5 PFU per cell and incubated at either 32°C (A, C, and E) or 39.5°C (B and D). Cells were harvested at 12 (A) or 36 (C and E) h postinfection for cultures incubated at 32°C and at 8 (B) or 24 (D) h postinfection for cultures incubated at 39.5°C. Cells were fixed with glutaraldehyde, embedded, sectioned, stained, and examined with a Phillips 201 electron microscope. (E) A higher magnification of the area demarcated by an arrow in panel C. (F) Mock-infected L cells incubated at 39.5°C for 24 h and processed according to the protocol used for infected cells. Bars, 1 μm (A to D and F) and 200 nm (E).
FIG. 6
FIG. 6
Subcellular localization of reovirus ςNS and μ2 proteins in cells infected with reovirus strain T3D. L cells were infected with T3D at an MOI of 10 PFU per cell and incubated at 37°C for 18 h. Cells were stained for ςNS by using ςNS-specific MAb 2H7 (B) and for μ2 by using a μ2-specific polyclonal antiserum (C) as primary antibodies followed by Alexa Fluor 546 goat anti-mouse IgG and Alexa Fluor 488 goat anti-rabbit IgG, respectively, as secondary antibodies. Images were obtained by using a confocal microscope. The ςNS protein is colored green, and the μ2 protein is colored red. (A) A DIC image of the field was obtained. (D) In the merged image, colocalization of ςNS and μ2 is indicated by the yellow color. The arrow indicates a viral inclusion in which three different zones of viral proteins are evident: a red (μ2) center, a yellow (ςNS and μ2) intermediate zone, and a narrow peripheral zone of green (ςNS). Images were processed using Adobe Photoshop. Bars, 25 μm.
FIG. 7
FIG. 7
Subcellular localization of reovirus ςNS and μ2 proteins in cells infected with mutant strains tsE320 and tsH11.2. L cells were infected with either tsE320 (A to D) or tsH11.2 (E to H) at an MOI of 10 PFU per cell and incubated at 39.5°C for either 12 (tsH11.2) or 24 (tsE320) h. Cells were stained for ςNS by using ςNS-specific MAb 2H7 (B and F) and for μ2 by using a μ2-specific polyclonal antiserum (C and G) as primary antibodies followed by Alexa Fluor 488 goat anti-mouse IgG and Alexa Fluor 546 goat anti-rabbit IgG, respectively, as secondary antibodies. Images were obtained by using a confocal microscope. The ςNS protein is colored green, and the μ2 protein is colored red. (A and E) A DIC image of each field was obtained. (D and H) In the merged images, lack of colocalization of ςNS and μ2 is indicated by the lack of yellow color. Images were processed using Adobe Photoshop. Bars, 25 μm.
FIG. 8
FIG. 8
Subcellular localization of reovirus proteins in cells infected with mutant strains tsE320 and tsH11.2. L cells were infected with either tsE320 (A to D) or tsH11.2 (E to H) at an MOI of 10 PFU per cell and incubated at 39.5°C for either 18 (tsH11.2) or 24 (tsE320) h. Cells infected with tsE320 were stained for μ2 by using a μ2-specific polyclonal antiserum (B) and for μ1/μ1C by using μ1/μ1C-specific MAb 8H6 (C) as primary antibodies followed by Alexa Fluor 546 goat anti-rabbit IgG and Alexa Fluor 488 goat anti-mouse IgG, respectively, as secondary antibodies. Cells infected with tsH11.2 were stained for ςNS by using a ςNS-specific polyclonal antiserum (F) and for μ1/μ1C by using μ1/μ1C-specific MAb 8H6 (G) as primary antibodies followed by Alexa Fluor 546 goat anti-rabbit IgG and Alexa Fluor 488 goat anti-mouse IgG, respectively, as secondary antibodies. Images were obtained by using a confocal microscope. In images of cells infected with tsE320, the μ2 protein is colored red and the μ1/μ1C protein is colored green. In images of cells infected with tsH11.2, the ςNS protein is colored green and the μ1/μ1C protein is colored red. (A and E) A DIC image of each field was obtained. (D and H) In the merged images, colocalization of the proteins is indicated by the yellow color. Images were processed using Adobe Photoshop. Bars, 25 μm.
FIG. 9
FIG. 9
Subcellular localization of ςNS and μ2 proteins in cells infected with T3D, determined at different times postinfection. L cells were infected with T3D at an MOI of 10 PFU per cell and incubated at 37°C for the time periods shown. Cells were stained for ςNS by using a ςNS-specific polyclonal antiserum directly conjugated to Alexa Fluor 546 and for μ2 by using a μ2-specific polyclonal antiserum directly conjugated to Alexa Fluor 488. Images were obtained by using a confocal microscope. The ςNS protein is colored green, and the μ2 protein is colored red. A DIC image of each field was obtained. In the merged image, colocalization of ςNS and μ2 is indicated by the yellow color. Images were processed using Adobe Photoshop. Bars, 25 μm.
FIG. 9
FIG. 9
Subcellular localization of ςNS and μ2 proteins in cells infected with T3D, determined at different times postinfection. L cells were infected with T3D at an MOI of 10 PFU per cell and incubated at 37°C for the time periods shown. Cells were stained for ςNS by using a ςNS-specific polyclonal antiserum directly conjugated to Alexa Fluor 546 and for μ2 by using a μ2-specific polyclonal antiserum directly conjugated to Alexa Fluor 488. Images were obtained by using a confocal microscope. The ςNS protein is colored green, and the μ2 protein is colored red. A DIC image of each field was obtained. In the merged image, colocalization of ςNS and μ2 is indicated by the yellow color. Images were processed using Adobe Photoshop. Bars, 25 μm.

References

    1. Ahmed R, Chakraborty P R, Fields B N. Genetic variation during lytic reovirus infection: high-passage stocks of wild-type reovirus contain temperature-sensitive mutants. J Virol. 1980;34:285–287. - PMC - PubMed
    1. Ahmed R, Kauffman R S, Fields B N. Genetic variation during persistent reovirus infection: isolation of cold-sensitive and temperature-sensitive mutants from persistently infected L cells. Virology. 1983;131:71–78. - PubMed
    1. Antczak J B, Joklik W K. Reovirus genome segment assortment into progeny genomes studied by the use of monoclonal antibodies directed against reovirus proteins. Virology. 1992;187:760–776. - PubMed
    1. Coombs K M. Identification and characterization of a double-stranded RNA− reovirus temperature-sensitive mutant defective in minor core protein μ2. J Virol. 1996;70:4237–4245. - PMC - PubMed
    1. Coombs K M. Stoichiometry of reovirus structural proteins in virus, ISVP, and core particles. Virology. 1998;243:218–228. - PubMed

Publication types

Substances

LinkOut - more resources