. 2001 Jan 1;15(1):50-65.
doi: 10.1101/gad.828901.

Human breast cancer cells generated by oncogenic transformation of primary mammary epithelial cells

Affiliations

Human breast cancer cells generated by oncogenic transformation of primary mammary epithelial cells

B Elenbaas et al. Genes Dev. .

Abstract

A number of genetic mutations have been identified in human breast cancers, yet the specific combinations of mutations required in concert to form breast carcinoma cells remain unknown. One approach to identifying the genetic and biochemical alterations required for this process involves the transformation of primary human mammary epithelial cells (HMECs) to carcinoma cells through the introduction of specific genes. Here we show that introduction of three genes encoding the SV40 large-T antigen, the telomerase catalytic subunit, and an H-Ras oncoprotein into primary HMECs results in cells that form tumors when transplanted subcutaneously or into the mammary glands of immunocompromised mice. The tumorigenicity of these transformed cells was dependent on the level of ras oncogene expression. Interestingly, transformation of HMECs but not two other human cell types was associated with amplifications of the c-myc oncogene, which occurred during the in vitro growth of the cells. Tumors derived from the transformed HMECs were poorly differentiated carcinomas that infiltrated through adjacent tissue. When these cells were injected subcutaneously, tumors formed in only half of the injections and with an average latency of 7.5 weeks. Mixing the epithelial tumor cells with Matrigel or primary human mammary fibroblasts substantially increased the efficiency of tumor formation and decreased the latency of tumor formation, demonstrating a significant influence of the stromal microenvironment on tumorigenicity. Thus, these observations establish an experimental system for elucidating both the genetic and cell biological requirements for the development of breast cancer.


Figures

Figure 1
Figure 1
In vitro growth and anchorage-independent growth of the HMECs expressing various combinations of LT, hTERT, and H-rasV12. (A) Growth curves of Clonetics HMECs (PD23) (♦), HMECs expressing LT (▪), or HMECs expressing both LT and hTERT (●). The expression of LT enables HMECs to bypass senescence (M1) at PD39. The additional expression of hTERT enables the cells to bypass crisis (M2) at PD57. (B) HMECs were generated with the indicated combinations of LT, hTERT, and H-rasV12. The level of overexpression of H-rasV12 protein in the indicated populations of cells is compared by immunoblot analysis for H-Ras. The number of soft agar colonies is indicated for 5 × 104 cells. Results are expressed as the mean of three experiments +/− s.d. (C) Growth curves of the second population of HMECs, termed PHMECs (♦), PHMECs expressing LT (▪), or PHMECs expressing both LT and hTERT (●). (D) Immunoblot analysis of p16INK4a in 293T cells and the two populations of HMECs, each expressing LT, hTERT, and H-rasV12 (HMLER and PHMLER).
Figure 2
Figure 2
Comparison of the expression levels of LT, hTERT. and H-rasV12 in the HEK cells, BJ fibroblasts, and HMECs. (A) Immunoblot analysis demonstrates that the levels of LT in the HMECs are similar to those in the HEK and BJ cells. RT–PCR for ectopic hTERT mRNA shows that hTERT is expressed at similar levels in the three cell populations. The level of GAPDH mRNA in each sample was measured as an internal control for the RT–PCR. Immunoblot analysis of H-Ras shows a 12-fold overexpression of H-rasV12 in the HMECs, a 60-fold overexpression in the HEK cells, and a 10-fold overexpression in the BJ fibroblasts. (B) Telomerase activity as measured by the TRAP assay was compared in indicated cell populations. For each sample, a heat-treated control reaction with 200 ng of protein was performed followed by reactions with 200 ng and 50 ng of protein. The internal PCR control (IC) is indicated at the bottom.
Figure 3
Figure 3
Anchorage-independent growth of the HMECs expressing LT, hTERT, and different levels of H-rasV12. The level of overexpression of H-rasV12 is compared by immunoblot analysis with an antibody specific for H-Ras in the indicated cells. Three different populations of HMECs expressing different levels of H-rasV12 were generated by infection of HMECs expressing LT and hTERT with retrovirus generated from pBabe-hygro H-rasV12 (Ras-hygro), pBabe-zeo H-rasV12 (Ras-zeo), and pBabe-puro H-rasV12 (Ras-puro). The number of soft agar colonies is indicated for 5 × 104 cells. Results are expressed as the mean of three experiments +/− s.d.
Figure 4
Figure 4
Anchorage-independent growth of HEK cells expressing LT, hTERT, and different levels of H-rasV12. Two populations of HEK cells expressing different levels of H-rasV12 were generated by infection of HEK cells expressing LT and hTERT with retrovirus generated from pBabe-hygro H-rasV12 (Ras-hygro) and pBabe-puro H-rasV12 (Ras-puro). The level of overexpression of H-rasV12 is compared by immunoblot analysis with an anti-H-Ras antibody. The number of soft agar colonies is indicated for 5 × 103 cells. Results are expressed as the mean of three experiments +/− s.d.
Figure 5
Figure 5
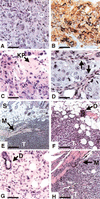
Histology of subcutaneous and orthotopic tumors derived from HMLER cells with high-level expression of H-rasV12. All panels were stained with hematoxylin and eosin with the exception of B. (A,B,C,E) Subcutaneous tumors; (D,F,G,H) mammary gland tumors. (A) The tumors were poorly differentiated with large pleomorphic nuclei and prominent nucleoli. (B) Immunoperoxidase staining with the cytokeratin antibody AE1/AE3 shows the epithelial nature of the tumor. (C) A subset of the tumors had regions of squamous differentiation and keratin pearls (KP). (D) A close intermingling of epithelial tumor cells and stromal fibroblasts (indicated by the arrows) was observed. The epithelial cells are the larger, paler staining cells and the fibroblasts are the smaller, elongated, pinker staining cells. A white T indicates tumor in E,F, and H. (E) Subcutaneous tumors showed infiltration through the thin layer of muscle (M) and the adipose tissue just beneath the skin (S). (F,G) Tumors that grew in the mammary glands infiltrated through adipocytes and around ducts (D). (H) One of the five mammary gland tumors showed infiltration into the abdominal muscle. Bars, 75 μm in A,C,D,G; 200 μm in B,F,H; 400 μm in E.
Figure 6
Figure 6
The latency of subcutaneous tumor formation is enhanced by mixing HMLER cells with Matrigel or early-passage human RMFs. (A) Comparison of the latency and rate of tumor formation of HEK cells (♦), BJ fibroblasts (█), and HMECs (●) each expressing LT, hTERT, and H-rasV12. (B) The latency of tumor formation of HMLER cells (●) was decreased by addition of Matrigel (█) or primary RMFs (RMF.1, ♦). Results are expressed as the mean of six tumors +/− s.d. at the indicated time points after injection.
Figure 7
Figure 7
Growth properties of two explanted tumor cell populations in comparison to the parental HMLER cells. (A) The in vitro growth rate of two populations of HMLER cells explanted from independent tumors (HMLER.NT1 and HMLER.NT2) was compared with that of the parental HMLER cells. The growth rate of HMLER cells is indicated by ●, HMLER.NT1 by ▪, and HMLER.NT2 by ▴. (B) Anchorage-independent growth of the same three populations of cells. Results are expressed as the mean of three experiments +/− s.d. for 5 × 104 cells. (C) Subcutaneous tumor formation of the three populations of cells with Matrigel addition. Results are expressed as the mean of 6 tumors +/− s.d. at the indicated time points after injection. (D) Immunoblot analysis of c-Myc protein in the indicated populations of HMECs and in the HMLER.NT1 and HMLER.NT2 cells.
Figure 8
Figure 8
Spectral karyotype (SKY) and FISH analysis of transformed HMEC and PHMEC cells. (A) Spectral classified karyotype of a near-diploid nontumorigenic HMEC cell (LT, hTERT, and low-level H-rasV12) showing trisomy of chromosome 8 and the translocation t(7;9). (B) Metaphase from A exhibiting three copies of c-myc gene. (C) Spectral classified karyotype of a near-diploid tumorigenic HMEC cell (LT, hTERT, and high-level H-rasV12) showing translocation t(3;8) as the only genomic rearrangement. (D) Metaphase from C with three copies of c-myc gene. One copy of c-myc is located on derivative chromosome 3 featuring translocation t(3;8)(q29;q23–24.3). (E) Spectral classified karyotype of a near-tetraploid tumorigenic PHMEC cell (LT, hTERT, and high-level H-rasV12) revealing the presence of one isochromosome 8(q), recurrent translocations t(1;7) and t(6;10), and additional random changes t(1;12), del(1q), del(3p), and del(11p). (F) Metaphase from a hypo-tetraploid tumorigenic PHMEC cell (LT, hTERT, and H-rasV12) after FISH with genomic c-myc probe, showing five copies of c-myc gene. (G) Metaphase from a hyper-tetraploid tumorigenic PHMEC cell (LT, hTERT, and H-rasV12) showing six copies of c-myc on six normal chromosomes 8 and additional four copies of c-myc gene located on two isochromosomes 8(q). (H) Southern blot analysis for c-myc of HMECs expressing LT (lane 1) or the combination of LT, hTERT, and high-level H-rasV12 (lane 2), PHMECs expressing LT (lane 3), or the combination of LT, hTERT, and high-level H-rasV12 (lane 4). (I) Immunoblot analysis of c-Myc and actin from the indicated cells. The normalized levels of c-Myc in the indicated cells as compared with the primary HMEC or PHMEC (first lane of each group) were HMECs expressing LT, hTERT, and Ras-hygro (1.5), HMECs expressing LT, hTERT, and Ras-puro (1.4), and PHMECs expressing LT, hTERT, and Ras-puro (2.5).

References

    1. Balmain A, Brown K, Akhurst RJ, Fee FM. Molecular analysis of chemical carcinogenesis in the skin. Br J Cancer Suppl. 1988;9:72–75. - PMC - PubMed
    1. Band V, De Caprio JA, Delmolino L, Kulesa V, Sager R. Loss of p53 protein in human papillomavirus type 16 E6-immortalized human mammary epithelial cells. J Virol. 1991;65:6671–6676. - PMC - PubMed
    1. Barcellos-Hoff MH, Ravani SA. Irradiated mammary gland stroma promotes the expression of tumorigenic potential by unirradiated epithelial cells. Cancer Res. 2000;60:1254–1260. - PubMed
    1. Bartek J, Durban EM, Hallowes RC, Taylor-Papadimitriou J. A subclass of luminal epithelial cells in the human mammary gland, defined by antibodies to cytokeratins. J Cell Sci. 1985;75:17–33. - PubMed
    1. Bos JL. The ras gene family and human carcinogenesis. Mutat Res. 1988;195:255–271. - PubMed

Publication types

MeSH terms