Comparative Study
. 2001 Jan;11(1):55-66.
doi: 10.1101/gr.160601.

Patterns of chromosomal duplication in maize and their implications for comparative maps of the grasses

Affiliations
Comparative Study

Patterns of chromosomal duplication in maize and their implications for comparative maps of the grasses

B S Gaut. Genome Res. 2001 Jan.

Abstract

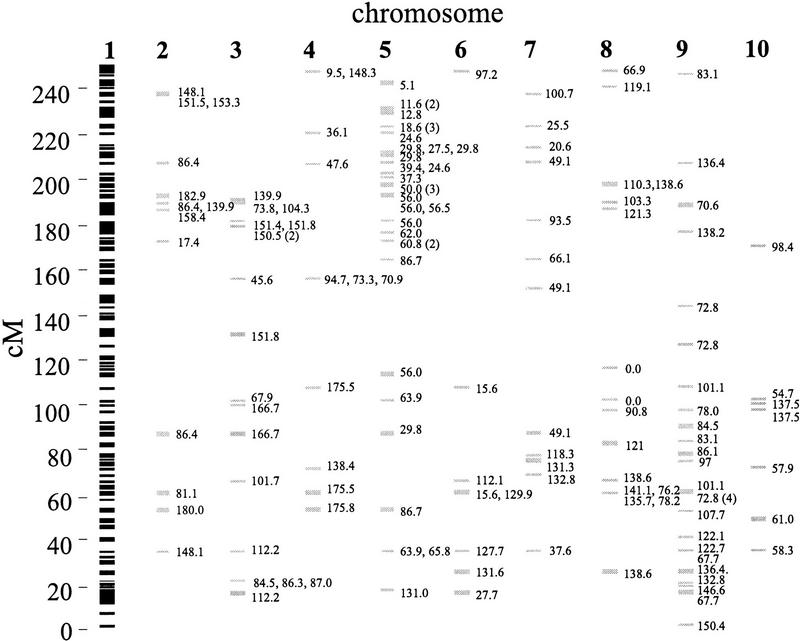
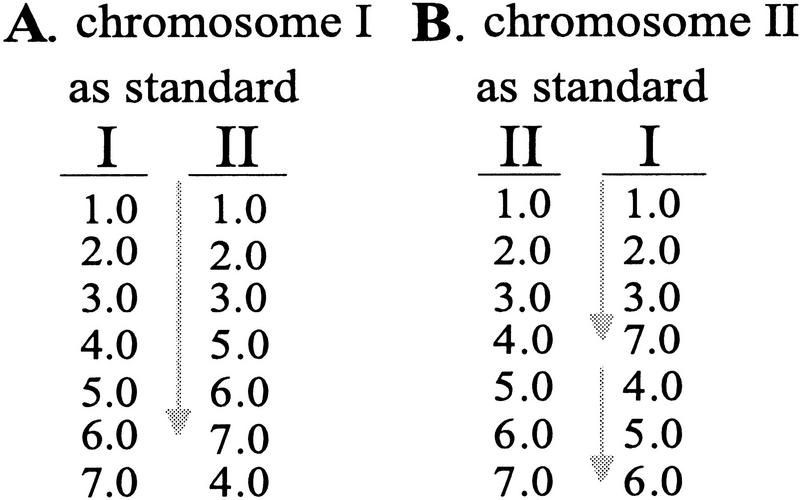
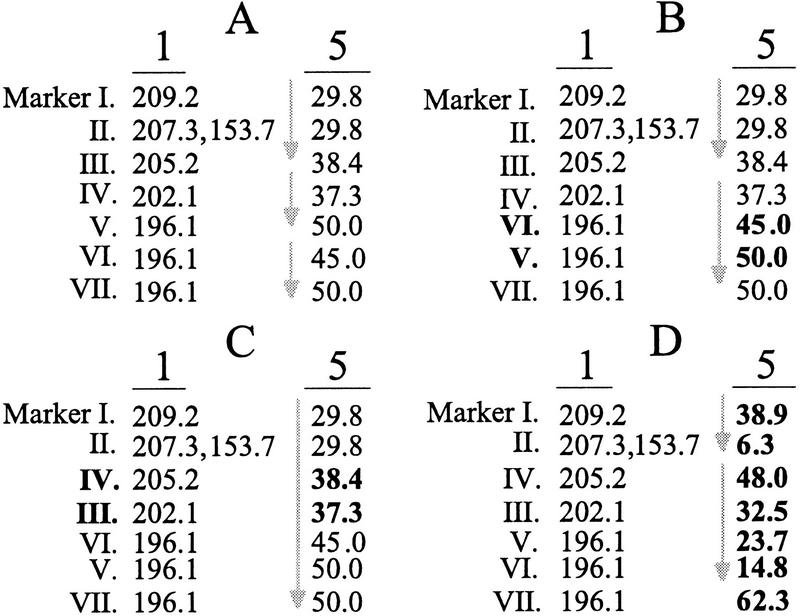
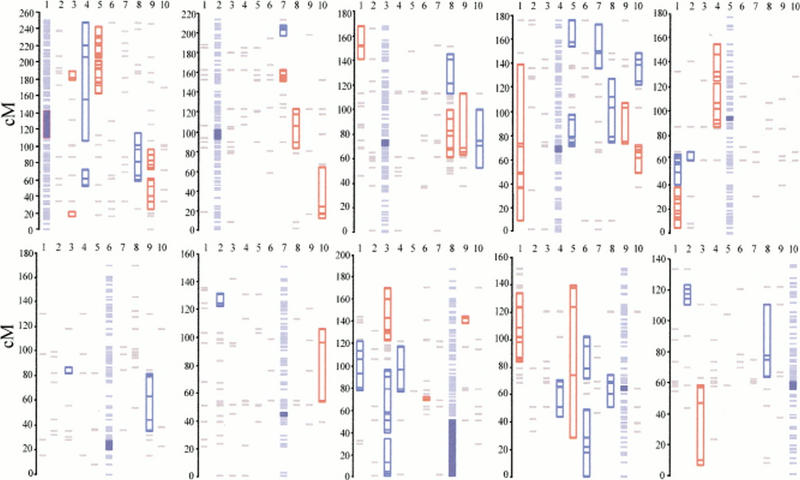
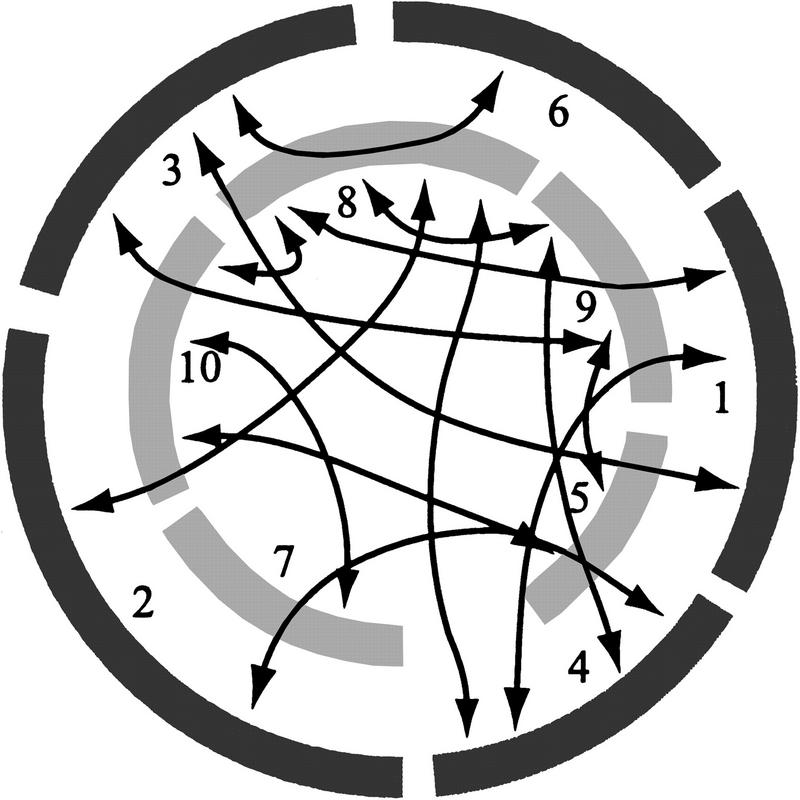
The maize genome contains extensive chromosomal duplications that probably were produced by an ancient tetraploid event. Comparative cereal maps have identified at least 10 duplicated, or homologous, chromosomal regions within maize. However, the methods used to document chromosomal homologies from comparative maps are not statistical, and their criteria are often unclear. This paper describes the development of a simulation method to test for the statistical significance of marker colinearity between chromosomes, and the application of the method to a molecular map of maize. The method documents colinearity among 24 pairs of maize chromosomes, suggesting homology in maize is more complex than represented by comparative cereal maps. The results also reveal that 60%-82% of the genome has been retained in colinear regions and that as much as a third of the genome could be present in multiple copies. Altogether, the complex pattern of colinearity among maize chromosomes suggests that current comparative cereal maps do not adequately represent the evolution and organization of the maize genome.


Figures

Figure 1
Figure 1
A diagram of the UMC98 map of chromosome 1 showing markers that cross-hybridize between chromosome 1 and the other nine chromosomes. The vertical axis is the map position on chromosome 1. Black lines indicate markers mapped to chromosome 1, the standard chromosome; markers that cross-hybridize to other chromosomes are shown in gray with their map position(s) on the tester chromosome. Parentheses indicate the number of markers mapped to the same location.
Figure 2
Figure 2
Colinearity depends on which chromosome is the standard and which is the tester. Each row shows the centimorgan location of a hypothetical marker that cross-hybridizes to two chromosomes. (Gray arrows) Colinear runs of markers between the chromosomes. (A) With chromosome I as the standard, a colinear run contains six markers. (B) With chromosome II as the standard, the longest run has four markers. Such asymmetry is common in maize data and probably represents intrachromosomal rearrangements.
Figure 3
Figure 3
Colinearity based on hypothesized map data from seven markers that cross-hybridize between chromosomes 1 and 5. (A) Marker II hybridizes to two positions on chromosome 1 (153.7 and 207.3 cM). Based on the position of marker II at 207.3 cM, markers I through III define a colinear run of three markers (gray arrow). Some additional colinear runs of n = 2 markers are also shown. (B) Markers V, VI, and VII are binned at 196.1 cM on chromosome 1, and hence their order is ambiguous. Markers VI and V (in boldface) can be rearranged to maximize the number of markers in a colinear run. (C) Maps contain statistical error in the assignment of linear order. If the potential error extends 2.0 cM in either direction of a marker, then the relative position of markers III and IV (in boldface) are uncertain on chromosome 5 because of their close location. A colinear run can extend through these markers in recognition of map error, resulting in a colinear run of seven markers. Recognition of error must be applied to both chromosomes. (D) A simulated data set showing randomized centimorgan locations on tester chromosome 5 (in boldface). The simulated data result in two colinear runs of n = 4 and n = 2 markers (gray arrows).
Figure 4
Figure 4
The results of colinearity tests. For each panel, the 10 columns represent the 10 chromosomes. The standard chromosome is shown in light blue, with the centromere in royal blue; the vertical axis represents the centimorgan location on the standard chromosome. Significant colinearities between the standard and tester chromosome are shown on the tester chromosomes in either red (P < 0.005) or dark blue (P < 0.05). (Gray lines) Cross-hybridizing markers that do not comprise significant colinear regions.
Figure 5
Figure 5
A schematic representing maize homologies inferred from grass comparative maps and the colinearity test. (light and dark gray arcs) Maize chromosomes as often represented in grass comparative maps (Devos and Gale 1997; Gale and Devos 1998a, 1998b; Moore et al. 1995b), with chromosome numbers given. (overlap between chromosomes) Homologies detected by comparative mapping and also by the colinearity test. (black arrows) Additional interchromosomal colinearities detected by the colinearity test.

References

    1. Ahn S, Tanksley SD. Comparative linkage maps of the rice and maize genomes. Proc Natl Acad Sci. 1993;90:7980–7984. - PMC - PubMed
    1. Ahn S, Anderson JA, Sorrells ME, Tanksley SD. Homoeologous relationships of rice, wheat and maize chromosomes. Mol Gen Genet. 1993;241:483–490. - PubMed
    1. Anderson E. What is Zea mays? A report of progress. Chron Bot. 1945;9:88–92.
    1. Bennetzen JL. Comparative sequence analysis of plant nuclear genomes: Microcolinearity and its many exceptions. Plant Cell. 2000;12:1021–1029. - PMC - PubMed
    1. Bennetzen JL, Freeling M. Grasses as a single genetic system—Genome composition, colinearity and compatibility. Trends Genet. 1993;9:259–261. - PubMed

Publication types

LinkOut - more resources