

Ambulatory abdominal inductance plethysmography: towards objective assessment of abdominal distension in irritable bowel syndrome
- PMID: 11156643
- PMCID: PMC1728192
- DOI: 10.1136/gut.48.2.216
Ambulatory abdominal inductance plethysmography: towards objective assessment of abdominal distension in irritable bowel syndrome
Abstract
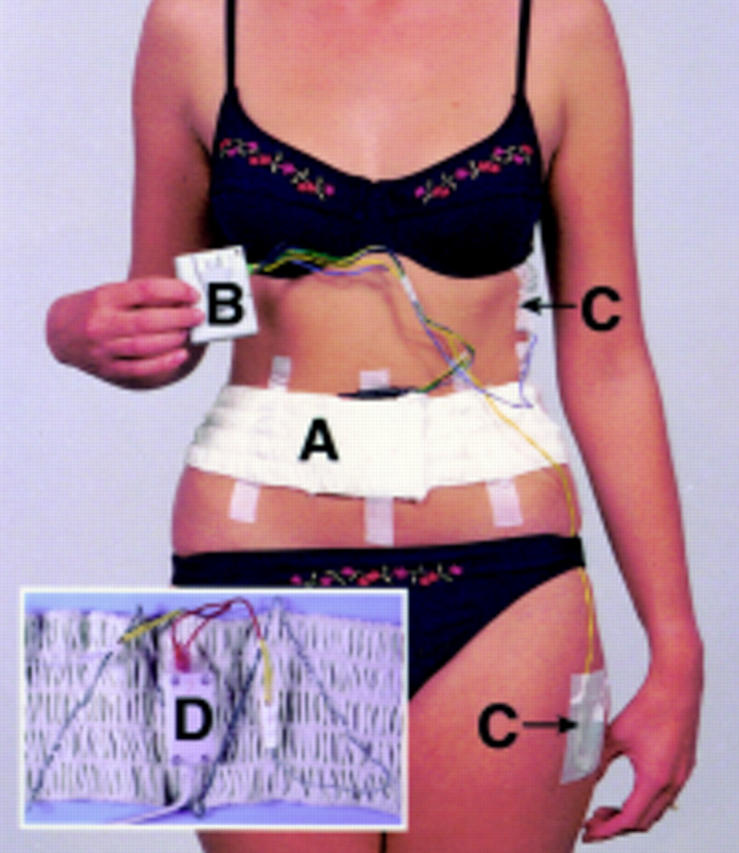
Background: Abdominal distension is one of the cardinal features of irritable bowel syndrome (IBS) with patients often ranking it as more intrusive than their pain or bowel dysfunction. If this symptom could be quantified accurately and reliably it would provide, for the first time, an objective way of assessing this disorder. Using the principle of inductance plethysmography we have developed a microprocessor based system capable of recording even minimal changes in girth over 24 hours and we describe its validation and establish normal ranges.
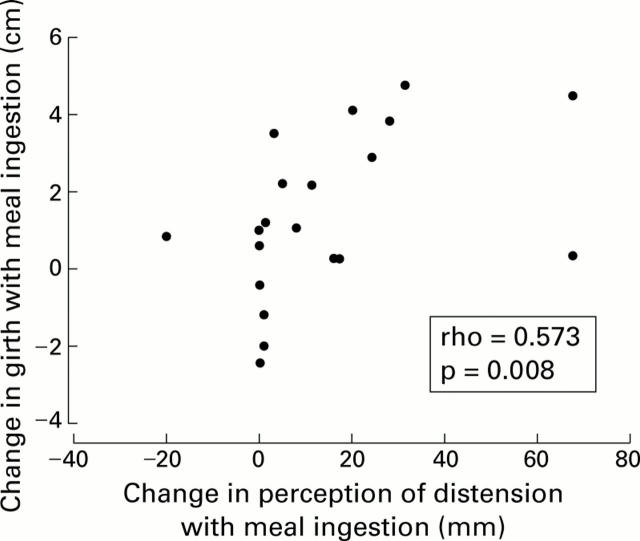
Methods: Twenty four hour recordings were made in 20 healthy female volunteers (aged 23-58 years) to assess changes in abdominal girth with respect to time, posture, meals, and sleep. Normal daily activity was encouraged and meals were standardised. The feeling of abdominal distension was also assessed using a visual analogue scale.
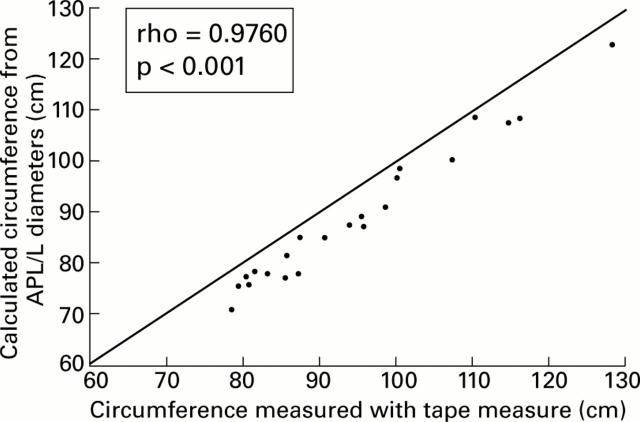
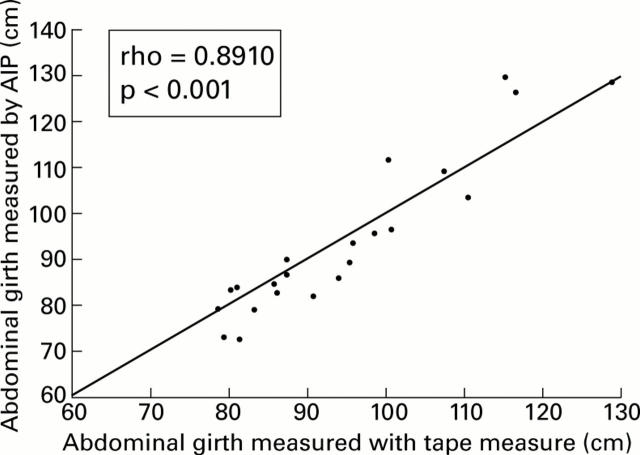
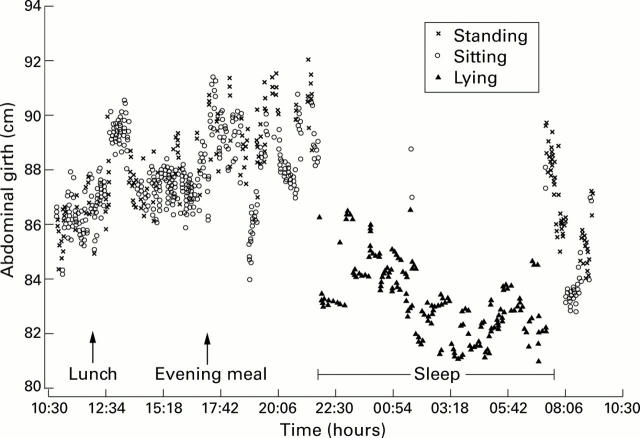
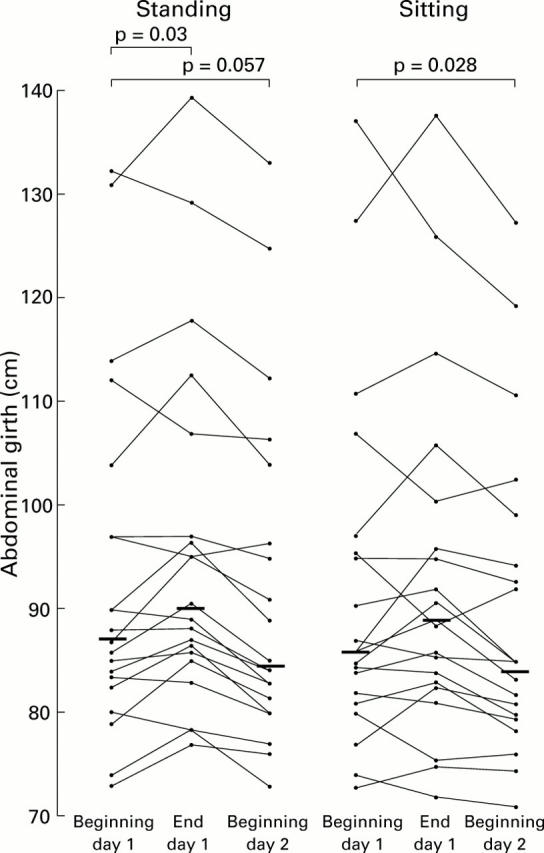
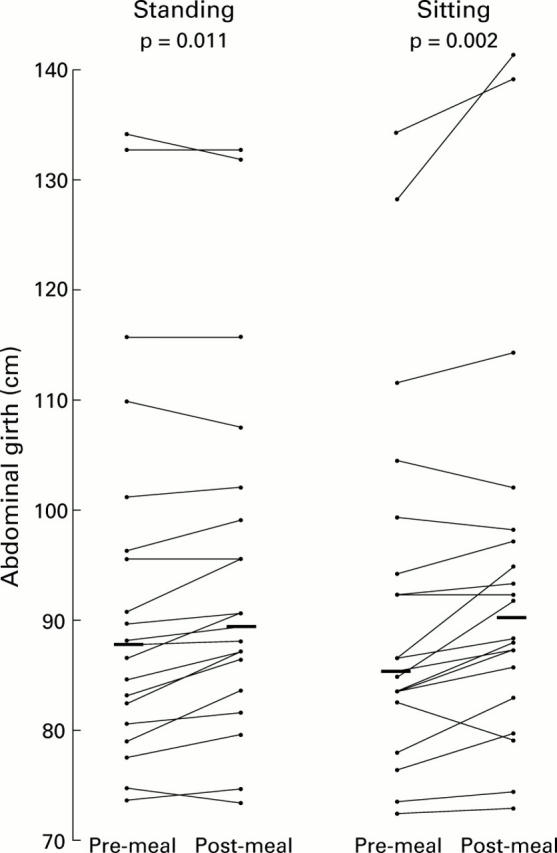
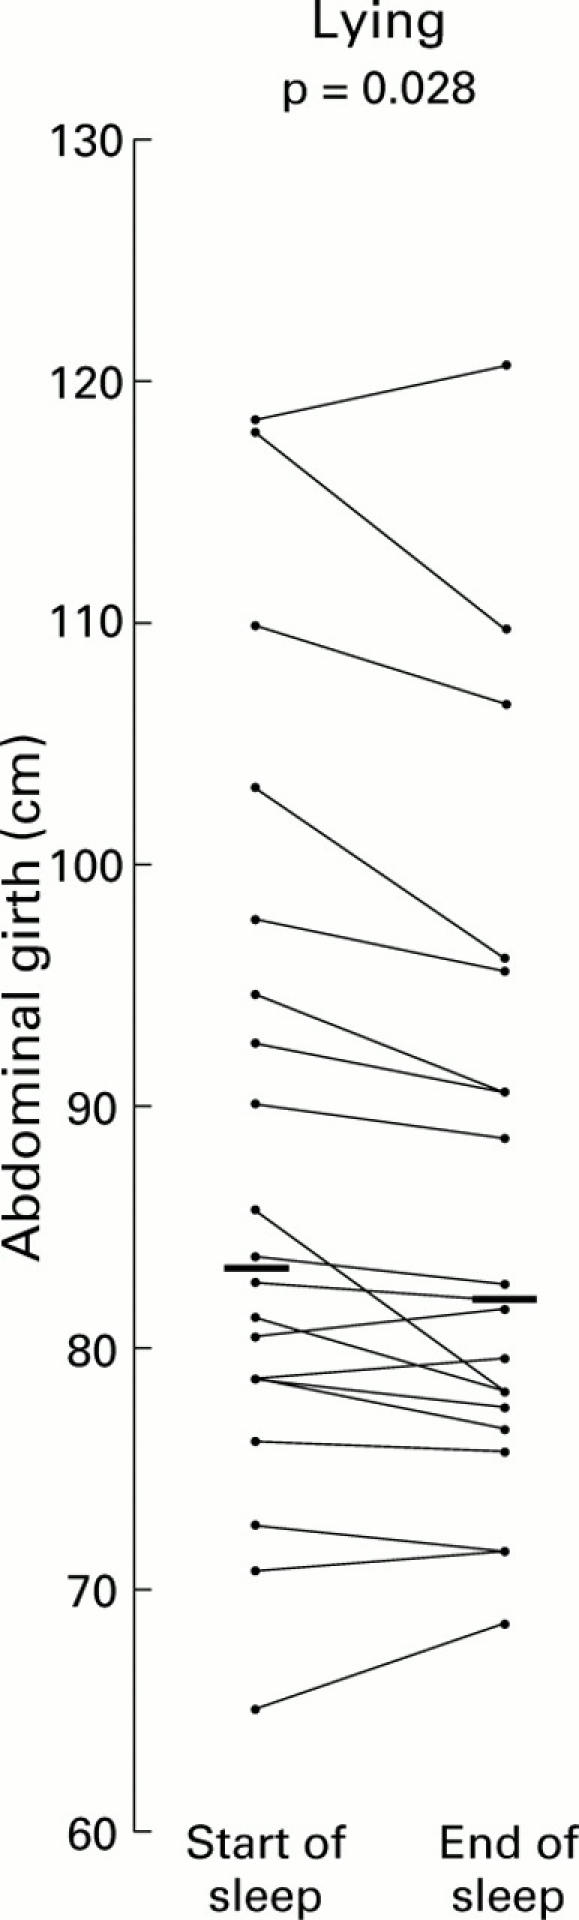
Findings: Measurement of abdominal girth using abdominal inductance plethysmography (AIP) at a static point in time showed a close relationship with that measured using a tape measure (rho=0.8910, p<0.001). Furthermore, girth was significantly greater both in the sitting and standing postures compared with lying (p<0.01). Measurement over a 24 hour period showed that girth was significantly greater at the end compared with the beginning of the day, and ingestion of a standard meal also increased its value (p<0.05). Sleep was associated with a reduction in girth (p<0.05).
Conclusions: AIP promises to add an objective dimension to the assessment of IBS which could prove invaluable in clinical trials. Furthermore, it should aid research into the pathogenesis of this symptom for which no satisfactory explanation has yet emerged.
Figures
References
Publication types
MeSH terms
LinkOut - more resources
Full Text Sources
Other Literature Sources
Medical
Miscellaneous