. 2001 Feb;22(2):294-300.

Effect of focal and nonfocal cerebral lesions on functional connectivity studied with MR imaging

Affiliations

Effect of focal and nonfocal cerebral lesions on functional connectivity studied with MR imaging

M Quigley et al. AJNR Am J Neuroradiol. 2001 Feb.

Abstract

Background and purpose: Functional connectivity MR (fcMR) imaging is used to map regions of brain with synchronous, regional, slow fluctuations in cerebral blood flow. We tested the hypothesis that focal cerebral lesions do not eradicate expected functional connectivity.

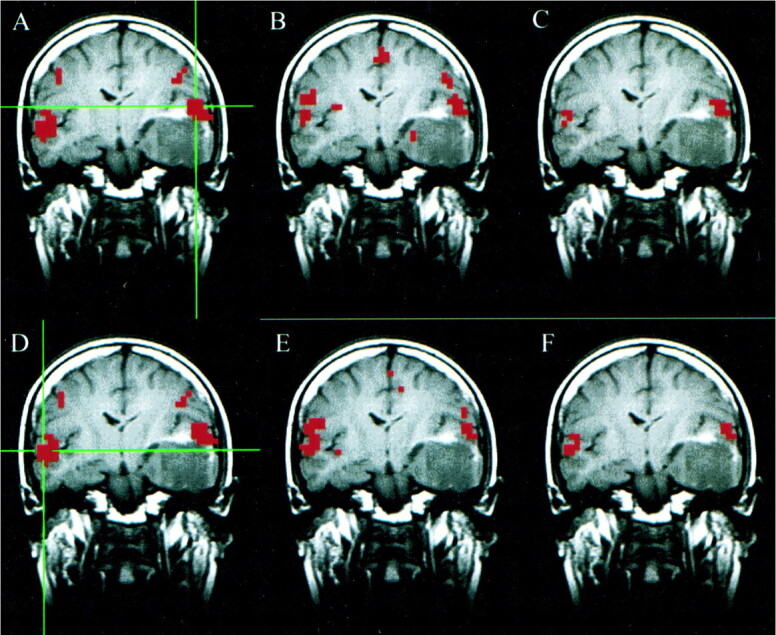
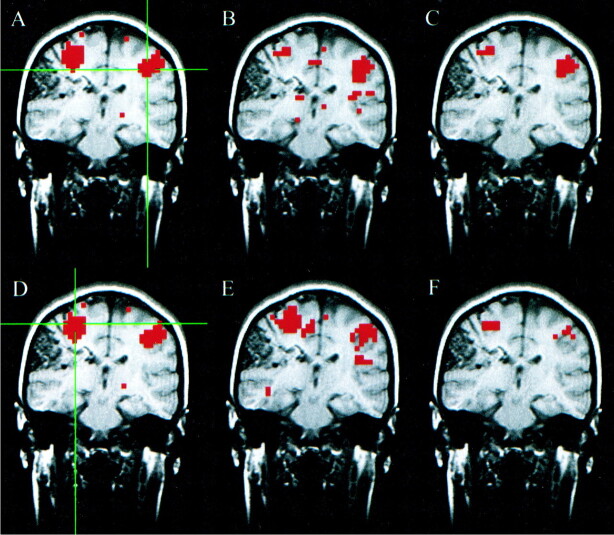
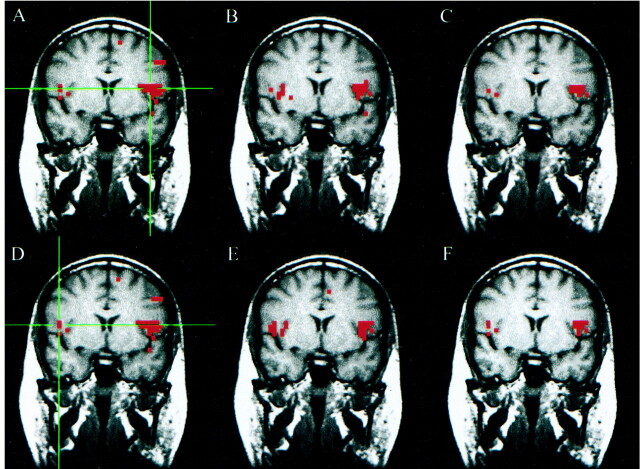
Methods: Functional MR (fMR) and fcMR maps were acquired for 12 patients with focal cerebral tumors, cysts, arteriovenous malformations, or in one case, agenesis of the corpus callosum. Task activation secondary to text listening, finger tapping, and word generation was mapped by use of fMR imaging. Functional connectivity was measured by selecting "seed" voxels in brain regions showing activation (based on the fMR data) and cross correlating with every other voxel (based on data acquired while the subject performed no task). Concurrence of the fMR and fcMR maps was measured by comparing the location and number of voxels selected by both methods.

Results: Technically adequate fMR and fcMR maps were obtained for all patients. In patients with focal lesions, the fMR and fcMR maps correlated closely. The fcMR map generated for the patient with agenesis of the corpus callosum failed to reveal functional connectivity between blood flow in the left and right sensorimotor cortices and in the frontal lobe language regions. Nonetheless, synchrony between blood flow in the auditory cortices was preserved. On average, there was 40% concurrence between all fMR and fcMR maps.

Conclusion: Patterns of functional connectivity remain intact in patients with focal cerebral lesions. Disruption of major neuronal networks, such as agenesis of the corpus callosum, may diminish the normal functional connectivity patterns. Therefore, functional connectivity in such patients cannot be fully demonstrated with fcMR imaging.


Figures

<sc>fig</sc> 1.
fig 1.
A–F, Coronal images in a patient with a left temporal oligodendroglioma. Student's t test, task-activation map for the auditory, text-listening paradigm (A and D) shows activation in the superior temporal gyri bilaterally. The functional connectivity map (B) based on a seed voxel in the left superior temporal gyrus (crosshairs in A) shows synchronous blood flow changes bilaterally in the superior temporal gyri. The intersect map (C) shows voxels that passed the thresholds in both the fMR (A) and fcMR (B) maps. It reflects a 33% concurrence ratio between the activation and connectivity analyses for this left hemisphere seed voxel. The functional connectivity map (E) based on a seed voxel in the right superior temporal gyrus (crosshairs in D) also shows synchronous blood flow changes bilaterally in the superior temporal gyri. The intersect map (F) reflects a 41% concurrence ratio between the activation map (D) and connectivity map (E) for this right hemisphere seed voxel
<sc>fig</sc> 2.
fig 2.
A–F, Coronal images in a patient with a right parasylvian arteriovenous malformation. Student's t test, task-activation map for the motor, finger-tapping paradigm (A and D) shows activation in the sensorimotor cortices bilaterally. The functional connectivity maps (B and E) based on seed voxels chosen from the left and right sensorimotor cortices (crosshairs in A and D, respectively) show synchronous blood flow changes bilaterally in the sensorimotor cortices. The intersect maps (C and F) show the voxels common to both the task-activation and functional connectivity maps. They reflect a 49% and 43% concurrence ratio between the activation and connectivity analyses for these left and right hemisphere seed voxels, respectively.
<sc>fig</sc> 3.
fig 3.
A–F, Coronal images in a patient with a left parietal cavernous angioma (not seen in this slice). Student's t test, task-activation map for the language, word-generation paradigm (A and D) shows activation in the left inferior and middle frontal gyri, and to a lesser extent in the right middle and inferior frontal gyri. The functional connectivity map (B) based on a seed voxel in the left inferior frontal gyrus (crosshairs in A) shows a pattern of connectivity in the left and right frontal lobes. The intersect map (C) shows voxels in both hemispheres passing the threshold in both the fMR and fcMR maps. It reflects a 51% concurrence ratio between activation and connectivity analyses for this left hemisphere seed voxel. The fMR (D), fcMR (E), and intersect (F) maps are shown for a seed voxel in the right inferior frontal gyrus (crosshairs in D). For this right hemisphere seed voxel, there was a 56% concurrence between the activation and connectivity maps. These data were not included in our tabulation because bilateral activation for language was not seen in all patients.
<sc>fig</sc> 4.
fig 4.
A–F, Axial images in a patient with agenesis of the corpus callosum and midline cystic structures. Student's t test, task-activation map for the motor, finger-tapping paradigm (A) shows activation in the sensorimotor cortices bilaterally as well as in the supplemental motor area. The functional connectivity map (B) based on a seed voxel in the right sensorimotor cortex (crosshairs in A) shows synchronous blood flow changes in the ipsilateral sensorimotor cortex only. The intersect map (C) shows voxels that passed the thresholds in both the fMR (A) and fcMR (B) maps. It reflects a 27% concurrence ratio between the activation and connectivity analyses for this right hemisphere seed voxel. Student's t test, task-activation map for the auditory, text-listening paradigm (D) shows activation in the superior temporal gyri bilaterally. The functional connectivity map (E) based on a seed voxel in the left superior temporal gyrus (crosshairs in D) shows synchronous blood flow changes in both the ipsilateral and the contralateral superior temporal gyri. The intersect map (F) reflects a 45% concurrence ratio between the activation (D) and connectivity (E) maps for this left hemisphere seed voxel.

Comment in

References

    1. Biswal B, Yetkin FZ, Haughton VM, Hyde JS. Functional connectivity in the motor cortex of resting human brain using echo-planar MRI. Magn Reson Med 1995;34:537-541 - PubMed
    1. Fasano VA, Urciuoli R, Bolognese P, Mostert M. Intraoperative use of laser doppler in the study of cerebral microvascular circulation. Acta Neurochir (Wien) 1988;95:40-48 - PubMed
    1. Cordes D, Haughton VM, Arfanakis K, et al. Mapping functionally related regions of brain with functional connectivity MR imaging. AJNR Am J Neuroradiol 2000;21:1636-1644 - PMC - PubMed
    1. Morris III GL, Mueller WM, Yetkin FZ, et al. Functional magnetic resonance imaging in partial epilepsy. Epilepsia 1994;35:1194-1198 - PubMed
    1. Mueller WM, Yetkin FZ, Hammeke TA, et al. Functional magnetic resonance mapping of the motor cortex in patients with cerebral tumors. Neurosurgery 1996;39:515-521 - PubMed

MeSH terms